| Issue |
A&A
Volume 635, March 2020
|
|
|---|---|---|
| Article Number | A73 | |
| Number of page(s) | 20 | |
| Section | Planets and planetary systems | |
| DOI | https://doi.org/10.1051/0004-6361/201937127 | |
| Published online | 10 March 2020 | |
A multiplicity study of transiting exoplanet host stars
I. High-contrast imaging with VLT/SPHERE★,★★
1
Leiden Observatory, Leiden University,
PO Box 9513,
2300 RA
Leiden,
The Netherlands
e-mail: This email address is being protected from spambots. You need JavaScript enabled to view it.
2
Astrophysics Group, Keele University,
Staffordshire
ST5 5BG, UK
3
Sterrenkundig Instituut Anton Pannekoek,
Science Park 904,
1098 XH
Amsterdam,
The Netherlands
Received:
17
November
2019
Accepted:
17
January
2020
Abstract
Context. Many main-sequence stars are part of multiple systems. The effect of stellar multiplicity on planet formation and migration, however, is poorly understood.
Aims. We study the multiplicity of stars hosting known transiting extra-solar planets to test competing theories on the formation mechanisms of hot Jupiters.
Methods. We observed 45 exoplanet host stars using the infrared dual imaging spectrograph of the Spectro-Polarimetric High-Contrast Exoplanet Research (SPHERE) instrument at the Very Large Telescope to search for potential companions. For each identified candidate companion we determined the probability that it is gravitationally bound to its host by performing common proper motion checks and modelling of synthetic stellar populations around the host. In addition, we derived contrast limits as a function of angular separation to set upper limits on further companions in these systems. We converted the derived contrast into mass thresholds using AMES-Cond, AMES-Dusty, and BT-Settl models.
Results. We detected new candidate companions around K2-38, WASP-72, WASP-80, WASP-87, WASP-88, WASP-108, WASP-118, WASP-120, WASP-122, WASP123, WASP-130, WASP-131, and WASP-137. The closest candidates were detected at separations of 0.′′124±0.′′007 and 0.′′189±0.′′003 around WASP-108 and WASP-131; the measured K-band contrasts indicate that these are stellar companions of 0.35 ± 0.02 M⊙ and 0.62−0.04+0.05 M⊙, respectively. Including the re-detection and confirmation of previously known companions in 13 other systems, we derived a multiplicity fraction of 55.4−9.4+5.9%. For the representative sub-sample of 40 hot Jupiter host stars among our targets, the derived multiplicity rate is 54.8−9.9+6.3%. Our data do not confirm any trend that systems with eccentric planetary companions are preferably part of multiple systems. On average, we reached a magnitude contrast of 8.5 ± 0.9 mag at an angular separation of 0.′′5. This allows us to exclude additional stellar companions with masses higher than 0.08M⊙ for almost all observed systems; around the closest and youngest systems, this sensitivity is achieved at physical separations as small as 10 au.
Conclusions. Our study shows that SPHERE is an ideal instrument for detecting and characterising close companions to exoplanetary host stars. Although the second data release of the Gaia mission also provides useful constraints for some of the systems, the achieved sensitivity provided by the current data release of this mission is not good enough to measure parallaxes and proper motions for all detected candidates. For 14 identified companion candidates further astrometric epochs are required to confirm their common proper motion at 5σ significance.
Key words: planets and satellites: dynamical evolution and stability / planets and satellites: formation / planetary systems / binaries: visual / techniques: high angular resolution
Astrometry and photometry of the identified candidate companions are available at the CDS via anonymous ftp to cdsarc.u-strasbg.fr (130.79.128.5) or via http://cdsarc.u-strasbg.fr/viz-bin/cat/J/A+A/635/A73
Based on observations collected at the European Organisation for Astronomical Research in the Southern Hemisphere under ESO programmes 098.C-0589(A) and 099.C-0155(A).
© ESO 2020
1 Introduction
The detection and characterisation of extrasolar planets has evolved rapidly during the past decades. Many large-scale radial velocity surveys (RV; e.g. Baranne et al. 1996; Mayor et al. 2003; Cosentino et al. 2012) and transit surveys (e.g. Bakos et al. 2004; Pollacco et al. 2006; Auvergne et al. 2009; Borucki et al. 2010) have provided a statistically highly significant sample consisting of several thousands of exoplanets with various physical properties that mostly differ from what we had known from the solar system so far. Already the first exoplanet detected around a main sequence star, 51 Peg b (Mayor & Queloz 1995), showed drastically deviating attributes compared to all Solar System planets. With the detection of several similarly behaved Jovian planets on very close-in orbits with periods of a few days (Butler et al. 1997; Fischer et al. 1999), a new class of so-called hot Jupiters was established. These gas giants typically have masses higher than 0.3 MJup and separations to their host stars that are smaller than 0.1 au.
Although hundreds of hot Jupiter systems are known today, there is no consensus on a consistent formation pathway of these environments. Shortly after the discovery of 51 Peg b, Lin et al. (1996) argued that in situ formation of hot Jupiters through core accretion is disfavoured because the typical temperatures in protoplanetary discs at their characteristic separations are too high to facilitate the condensation of solids, hence preventing rocky cores from forming in these regions (Pollack et al. 1996). Simulations of Bodenheimer et al. (2000) and more recent results of Boley et al. (2016) and Batygin et al. (2016), however, challenge this hypothesis: previous assumptions on the amount of condensable solids in the circumstellar disc were based on abundances in the solar nebula, which might be too simplistic to cope with the huge variety observed in exoplanetary systems.
Alternatively to the in situ formation scenario, hot Jupiters might form at wider separations of several astronomical units and migrate inwards towards their detected position (Lin et al. 1996). Theories that describe this migration process, however, are still a highly controversial topic. Potential scenarios of this inward migration are required not only to reproduce the small orbital separations, but also to provide useful explanations for other properties of known hot Jupiters, for instance highly eccentric orbits (Udry & Santos 2007) or orbital misalignments with respect to the stellar rotation axis (Winn et al. 2010). Recent research shows that the observed spin-orbit misalignments may have a primordial origin caused by either magnetic fields of the star interacting with the protoplanetary disc (Lai et al. 2011) or gravitational interaction with massive stellar binaries (Batygin 2012). The high eccentricities, however, are not reproduced by an inward migration, as first proposed by Lin et al. (1996), due to damping of excited modes caused by gravitational interaction with material of the circumstellar disc (Kley & Nelson 2012). Other theories hypothesize a high-eccentricity migration of the companion after its formation (Socrates et al. 2012): after the planet has formed in a circular orbit of several astronomical units, it becomes excited to high eccentricities, and tidal dissipation at subsequent periastron passages reduces the orbital semi-major axis as well as the eccentricity gained. The excitation of high eccentricities may be caused by planet–planet scattering (Rasio & Ford 1996; Chatterjee et al. 2008; Wu & Lithwick 2011), through Kozai–Lidov (KL) oscillations due to a stellar binary (Eggleton & Kiseleva-Eggleton 2001; Wu & Murray 2003; Fabrycky & Tremaine 2007), or by a combination of these mechanisms (Nagasawa et al. 2008).
To test these theories, additional data of exoplanet host systems is required. Especially stellar binaries may play an important role in the evolution of exoplanetary systems because they are essential ingredients for explaining primordial spin-orbit misalignments or high-eccentricity migration due to KL mechanisms. Current estimates on the multiplicity fractions among transiting exoplanet host stars are not very conclusive and range from 7.6 ± 2.3% (Ngo et al. 2017) to 13.5% (Law et al. 2014) for RV planet hosts, but are usually higher for transiting planetary systems as the sample selection criteria for RV surveys impose an intrinsic bias against multiple stellar systems. Ngo et al. (2015) recently estimated a much higher multiplicity rate of 49 ± 9% for systems with transiting hot Jupiters compared to their RV analogues. To reduce the uncertainties on these ratios, it is necessary to expand the samples to achieve statistically more significant results.
For transiting planet hosts stars, observations at high spatial resolution are also an important tool to reject other scenarios that might cause the periodic dip in the light curve, in particular background eclipsing binaries. Furthermore, the derived properties of the exoplanet and its host star are normally measured under the assumption that all the light from the system comes from the host star, that is, there is no contamination from unresolved sources at very small projected separations. If this assumption is violated and the data are not corrected for the contaminating light, its presence may cause both the mass and radius of the planet to be systematically underestimated. In the worst-case scenario, a not-much-fainter nearby star could even be the planet host star, and measurements of the planet mass and radius under the assumption that the brightest star is the host would lead to planetary properties that are severely biased away from their true values (e.g. Evans et al. 2016b). In a companion paper (Southworth et al. 2020) we reanalyse the most strongly affected of the planetary systems included in the current work, in order to correct measurements of their physical properties for the light arising from the nearby companion stars we have found.
A powerful method for the detection of stellar companions at small angular separations is adaptive optics (AO)-assisted coronagraphic high-contrast imaging. We therefore launched a direct-imaging survey targeting host stars of transiting exoplanets. Starting with the TEPCat catalogue (Southworth 2011), we selected all targets that are observable from the Very Large Telescope (VLT) and that have an R-band magnitude brighter than 11 mag to enable the AO system to lock on the source as a natural guide star. A detailed list of the 45 studied objects and their properties is presented in Table 1.
In Sect. 2 of this article we describe the observations we have carried out, and in Sect. 3 we explain the applied data reduction techniques. We present the detected candidate companions (CCs), analyse the likelihood of each to be agravitationally bound component within a multiple stellar system, and present detection limits for all targets of our sample in Sect. 4. Finally, we discuss our results within the scope of the previous literature in Sect. 5, and we conclude in Sect. 6.
2 Observations
Our observations (PI: D. F. Evans) were carried out with the Spectro-Polarimetric High-contrast Exoplanet REsearch (SPHERE; Beuzit et al. 2019) instrument that is mounted on the Nasmyth platform of Unit 3 telescope (UT3) at the ESO VLT. SPHERE is assisted by the SAXO extreme AO system (Fusco et al. 2006) to obtain diffraction-limited data. The targets were observed using the integral field spectrograph (IFS, Claudi et al. 2008) of the instrument and the infrared dual imaging spectrograph (IRDIS, Dohlen et al. 2008) simultaneously. Within the scope of this article we focus on the analysis of the IRDIS data, which provide similar inner working angle (IWA) capabilities down to 100 mas (Wilby et al., in prep.), but a much larger field of view up to 5.′′ 5 in radial separation than the IFS. IRDIS was operated in classical imaging (CI, Vigan et al. 2010) mode applying a broadband Ks -band filter (Filter ID: BB_Ks). The filter has a bandwidth of ΔλKs = 313.5 nm centred around  nm. To suppress the stellar flux, an apodised pupil Lyot coronagraph (Soummer 2005; Carbillet et al. 2011; Guerri et al. 2011) was used (coronagraph ID: N_ALC_YJH_S). To locate the star position behind the coronagraphic mask, centre frames were taken alongside the science observations. For these frames, a sinusoidal pattern was applied to the deformable mirror to create four reference spots around the star. To perform precise photometry of potential companions, we obtained additional unsaturated non-coronagraphic flux images of each target with a neutral density filter in place. Furthermore, the observations in ESO period 98 were conducted in pupil-stabilised imaging mode, whereas the data in period 99 were collected in field-stabilised mode. A detailed description of the observational setup and the atmospheric conditions for all observations are presented in Appendix A.
Stellar and planetary properties of the targets.
3 Data reduction
The data reduction was performed using a custom processing pipeline based on the latest release of PynPoint (version 0.8.1; Stolker et al. 2019) that includes standard dark and flatfield calibrations. Bad pixels were replaced by the average inside a 5 × 5 box around the corresponding pixel. Furthermore, we corrected for the instrumental anamorphic distortion according to the description in the SPHERE manual. To achieve photon-noise-limited sensitivities, an accurate model of the thermal background is essential for Ks-band imaging. Unfortunately, no sky images without any source in the field of view were taken alongside the science observations of the program. We thus searched the ESO archive to find useful calibration files that were obtained with the same instrumental setup (i.e. exposure time, coronagraph, and filter choice). Within these constraints, we found exactly one suitable sky image taken as part of another program (PI: M. Kenworthy, ESO ID: 0101.C-0153). For an optimal background subtraction, we performed the sky subtraction for both sides of the detector individually. We cropped all images around the rough position of the star in the science frames and aligned the sky images to prominent features induced by the substrate of the inserted coronagraph. The alignment was performed using a cross-correlation in Fourier space according to Guizar-Sicairos et al. (2008) and Fienup (1997). While masking a region of 0.′′ 86 around the star, the aligned sky image was fitted to each individual science frame by a simple linear least-squares approach. This yielded one optimised scaling coefficient per science frame that the sky image had to be multiplied with, before the subtraction. The sky subtraction afterwards was applied to the full frame to ensure a precise background subtraction even for the location of the star. After sky subtraction, the science images were shifted to correct for their corresponding dither positions and centred by using the centre frames as described in the SPHERE manual. At this stage we averaged both detector sides for each exposure to dampen noise introduced by bad pixels. Finally, we de-rotated the data that were obtained in pupil-stabilised mode according to the difference in parallactic angle. An additional constant pupil offset of −135. °99 was taken into account as well. The rotation was skipped for data that were taken in field-stabilised imaging mode. For both pupil- and field-stabilised data, we finally performed a correction for the true north position given by a rotation of − 1. °75 according to Maire et al. (2016). No further point spread function (PSF) removal was performed, and our final image was obtained as the median of the processed stack.
4 Results and analysis
4.1 Determining consistent ages for the exoplanet host stars
We used version 1.2 of the program bagemass1 (Maxted et al. 2015) to estimate the age of each star based on the observed values of Teff, [Fe/H] and the mean stellar density ρ⋆. These values were obtained from the references listed in Table 1. The methods and assumptions used for thecalculation of the stellar model grid using the GARSTEC stellar evolution code are described in Serenelli et al. (2013) and Maxted et al. (2015). We set lower limits of 80 K on the standard error for Teff and 0.07 dex for the standard error on [Fe/H] and assumed flat prior distributions for the stellar mass and age. The ages derived are shown in Table 1. The values and errors quoted are the median and standard deviation of the sampled posterior age distributions provided by bagemass.
4.2 Characterisation of CCs
In the IRDIS data we detected 27 off-axis point sources around 23 stars of our sample. Compilations of these detections are presented in Figs. 1 and 2, which show new detections by our survey and previously known sources, respectively.
Sixteen of the 27 CCs have not been detected by similar surveys of the multiplicity of these exoplanet host stars. This impressivelydemonstrates the ability of high-contrast imaging with SPHERE. Only 256 s of on-target integration are sufficient to reach better sensitivities than previous surveys that have been carried out either with different AO-assisted instruments or with other observing strategies such as lucky imaging.
Becausewe did not perform any PSF subtraction, we characterised the companions directly in the median-combined images, applying the standard astrometric solution of IRDIS with a plate scale of 12.265 mas in Ks band. For the astrometric characterisation, we fitted a two-dimensional Gaussian function to the PSF of the companion. The magnitude contrast wasestimated with aperture photometry that we applied on both flux and science image around the previously determined centroid. We used an aperture size that is equivalent to the full width at half-maximum (FWHM) of the SPHERE PSF in Ks band of 55 mas and scaled the counts from the flux image to account for the difference in exposure time and applied neutral densityfilter. A detailed list of all detected CCs including their separations, position angles (PAs), and magnitude contrasts is presented inTable 2.
Furthermore, we calculated mass and temperature estimates based on the derived photometry using evolutionary models of (sub-)stellarobjects (e.g. Allard et al. 2001; Baraffe et al. 2003). Because various physical processes play major roles for objects of different temperatures, we used AMES-Cond, AMES-Dusty, and BT-Settl models for the characterisation of CCs with Teff< 1400 K, 1400 K < Teff < 2700 K, and Teff> 2700 K, respectively.
There are three potential scenarios, depending on the available data, with which the likelihood can be assessed that a CC is gravitationally bound to its host:
- 1
Gaia DR2 provides parallax and proper motion of the CC.
- 2
Previous studies have detected the CC and provide astrometric measurements of it. This includes the case that Gaia DR2 only provides the position of the CC at reference epoch J2015.5, but no parallax or proper motion estimates.
- 3
None of the information above is accessible.
In the first case, the hypothesis whether the CC is bound or not could be easily tested by the provided parallaxes and proper motions of primary and CC. For the second scenario, we tested the proper motion of the object instead and determined whether its astrometry over several epochs agrees with a co-moving companion. When no other data on the CC were available, we estimated the likelihood of its companionship by a synthetic model of the stellar population around the stellar coordinates. This analysis wasperformed in a similar way to that described by Dietrich & Ginski (2018). First we used TRILEGAL (Girardi et al. 2005)to simulate a stellar population for one square degree centred around the exoplanet host star. We chose the 2MASS K-band filter, which is in good agreement with the actual SPHERE filter used for the observations. The limiting magnitude provided for the simulation was based on the maximum contrast we reached around the particular target (see Sect. 4.4). Other than this, we used the default parameters of TRILEGAL v1.6. Following the description of Lillo-Box et al. (2014), we measured the likelihood of a CC to be a background object as
 (1)
(1)
where ρsim denotes the number of simulated stars per square degree around the exoplanet host and r is the radial separation of the corresponding CC. Because this analysis is purely based on statistical arguments, we did not classify the CCs within this category as background or bound, but rather flagged them as ambiguous objects, whose common proper motion needs to be confirmed by future studies. Because we base the further analysis of these ambiguous candidates only on the derived background probabilities (see Sect. 4.3), this classification does not affect the derived multiplicity fractions in any way. A detailed analysis for each detected CC is presented in the following subsections.
Most of the CCs that we detected with IRDIS are unresolved in the 2MASS catalogue (Cutri et al. 2012), which we used for calibrating the K-band magnitude of the host star. Only for WASP-8, WASP-111, and WASP-123 does the 2MASS catalogue provide spatially resolved flux measurements for the primary and CC. For the remaining cases, we had to assume that the flux of potential CCs is contributing to the listed 2MASS K-band magnitudeof the primary, but of course this contribution is negligible for large contrasts between both components. The corrected K -band magnitude for primary j from our sample that is hosting nj CCs with corresponding magnitude contrasts of ΔKj,ℓ for ℓ = 1, …, nj, is
 (2)
(2)
We applied this correction directly to the 2MASS system magnitudes that are presented in Table A.1. The updated K-band magnitudes of primaries with companions that are unresolved in 2MASS photometric data are listed in Table 2 instead.
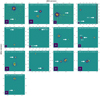 |
Fig. 1 Newly detected CCs around transiting exoplanet host stars from the SPHERE/IRDIS data. An unsharp mask was applied to highlight point sources. The origin of the axes is located at the position of the host star. The images are displayed using a logarithmic scale with arbitrary offsets and stretches to highlight the CCs. In all images north points up and east towards the left. The lower left corner of each image shows the reduced non-coronagraphic flux image with the same spatial scale and field orientation. |
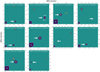 |
Fig. 2 Previously detected CCs around transiting exoplanet host stars from the SPHERE/IRDIS data. An unsharp mask was applied to highlight point sources. The origin of the axes is located at the position of the host star. The images are displayed using a logarithmic scale with arbitrary offsets and stretches to highlight the CCs. In all images north points up and east towards the left. The lower left corner of each image shows the reduced non-coronagraphic flux image with the same spatial scale and field orientation. |
4.2.1 HAT-P-41
In the discovery paper of a transiting hot Jupiter around HAT-P-41, Hartman et al. (2012) detected a potential stellar companion south of the star. The candidate was also detected by the lucky-imaging surveys of Wöllert et al. (2015) and Wöllert & Brandner (2015). Based on stellar population synthesis models, these studies concluded that the object is probably bound. Ngo et al. (2016) also detected the CC in Keck/NIRC2 Ks data and their colour analysis supported the theory that HAT-P-41 is a candidate multiple stellar system. Evans et al. (2016a) carried out an additional high-resolution imaging campaign, and they determined a common proper motion with 2σ significance. An additional companion to the system that was also detected by Evans et al. (2016a) was ruled out at a later stage and identified as an instrumental artefact (Evans et al. 2018). Therefore, previous studies have presented much evidence that HAT-P-41 is indeed a binary system. A conclusive common proper motion analysis and an accurate distance determination has not been published so far, however.
These previous results were confirmed by our SPHERE survey. We detected exactly one off-axis point source within the IRDIS field of view at the position of the previously detected CC with a separation of 3.′′ 621±0.′′004 and a position angle of 183. °9±0. °1. Furthermore, this companion was also detected by the second data release of the Gaia mission (Gaia DR2; Gaia Collaboration 2018). Bailer-Jones et al. (2018) provided distance estimates based on the Gaia parallaxes of 348 ± 4 pc and 338 ± 4 pc for HAT-P-41 and the CC, respectively. Considering the reported proper motions of  mas per year for the primary and
  mas per year for the secondary, we could conclude that both sources are co-distant and co-moving. Thus, the former CC is proven to be a stellar binary to HAT-P-41 and should be named HAT-P-41 B accordingly. From our comparison to BT-Settl models we derived a mass of
  M⊙ for the secondary component of the system.
Astrometry and photometry of CCs within the IRDIS field of view.
4.2.2 HAT-P-57
We re-detected the binary pair southwest of HAT-P-57 that has been found in the discovery paper of the transiting exoplanet HAT-P-57 b (Hartman et al. 2015). Hartman et al. (2015) have concluded that HAT-P-57 b must orbit the primary star because the detected binary is too faint in the optical to be responsible for the measured transit depth. Additional RV data of the system confirmed this hypothesis. From photometric H and L band analysis in a colour-magnitude diagram, Hartman et al. (2015) concluded that both binary components are co-evolutionary with the primary. Consequently, they argued that all three stars form a hierarchical triple system and should be named HAT-P-57 ABC. The masses of the smaller companions were estimated as 0.61 ± 0.10M⊙ and 0.53 ± 0.08M⊙. However, no other test for actual companionship, such as a common proper motion analysis, was performed.
With the two SPHERE epochs, we aimed to perform such an analysis. Hartman et al. (2015) only provided a separation of 2.′′ 667±0.′′001 from the primary to the binary pair and a separation of 0.′′ 225±0.′′002 between the two components of the binary itself. No individual separations from the primary to each component of the binary and no PAs were presented in their article. For this reason, we considered the binary pair as a single component and performed the proper motion test by splitting up the evaluation of separation and PA. The results of this analysis are visualised in Fig 3.
Alreadythe two SPHERE epochs imply that the binary agrees better with the hypothesis of being bound to HAT-P-57 than with being an unrelated background object. The additional separation measurement adapted from Hartman et al. (2015) that is based on MMT/Clio2 data from 2011 June 22 confirmed this hypothesis. Because their presented uncertainty in separation, only 1 mas, seemed to be very optimistic (the primary is heavily saturated), we adjusted this value to 20 mas to also account for the difference in separation of both CCs. This analysis proved that the binary pair is clearly incompatible with a stationary background object at more than 5σ significance. Therefore, CC 1 and CC 2 should be named HAT-P-57 B and HAT-P-57 C, respectively.
From the Ks-band photometry, we derived masses of  M⊙ and
  M⊙ for components B and C, respectively. Furthermore, we measured separations of 0.′′ 260±0.′′004 and 0.′′ 261±0.′′004 as well as PAs of 168. °3±0. °1 and 168. °4±0. °1 between components B and C for the SPHERE epochs. This is compatible with the increasing trend in separation when the separation of 0.′′ 225±0.′′002 between the two components in 2011 is also considered (Hartman et al. 2015). For a conclusive orbital motion fit of these two objects, a detailed analysis and another epoch at high astrometric precision are required, which is beyond the scope of the current work.
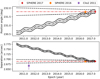 |
Fig. 3 Proper motion analysis of CC 1 and 2 detected around HAT-P-57. PA and separation are evaluated individually. The dashed cone presents the expected position of a gravitationally bound companion considering potential orbital motion of the object. The grey trajectory represents the expected location of a stationary background object, instead. For the MMT/Clio2data we adopted the separation measurement presented Hartman et al. (2015); no PA of the source at this epoch is provided. |
4.2.3 K2-38
Evans et al. (2018) reported a potential companion around K2-38 at a separation of 10.′′7752±0.′′0950, which is unfortunately outside the IRDIS field of view. The potential companion, however, was picked up by Gaia DR2, and together with two additional sources listed that were previously considered unlikely to be bound by Evans et al. (2018), these three objects were clearly proven to be background based on their parallaxes.
In our SPHERE data we detected a previously unknown CC south of the star at a separation of 1.′′ 378±0.′′014. Because no other astrometric data of this CC are available, we estimated its likelihood to be a background object using TRILEGAL. This provided a probability of 1.59% that the candidate is a background object.
4.2.4 WASP-2
In addition to the detection of the hot Jupiter WASP-2 b, Collier Cameron et al. (2007) also reported a potential stellar companion to WASP-2 b at a separation of 0.′′7 and a magnitudecontrast of ΔH = 2.7 mag. This companion was detected by several follow-up surveys (Daemgen et al. 2009; Bergfors et al. 2013; Adams et al. 2013; Ngo et al. 2015; Wöllert et al. 2015) and photometric analysis suggests a spectral type of late-K to early-M dwarf. The most recent astrometric measurements by Evans et al. (2016a) proved a common proper motion of the companion with its host at more than 5σ significance. Furthermore, they detected a linearly decreasing separation between the stellar companion and the primary, implying a nearly edge-on orbital solution, which we could confirm with our data.
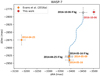 |
Fig. 4 Proper motion analysis of CC 1 around WASP-7. The dashed blue line represents the trajectory of a static background (bg) object. |
4.2.5 WASP-7
Evans et al. (2016a) reported a CC around WASP-7 at a separation of 4.′′414±0.′′011 and a PA of 228. °73±0. °12. However, no extensive analysis was performed to determine whether this candidate is actually bound to the exoplanet host star. The separation and PA presented in Evans et al. (2016a) are an average of three individual epochs obtained on 2014 April 25, May 9, and May 16. As presented in Fig. 4, the astrometry based on the data from 2014 April 25 does not agree with the two later epochs. Instead of averaging over all three datapoints, we used the data from 2014 May 9 as baseline for a further proper motion analysis2.
We also detected the candidate in our IRDIS data with a separation of 4.′′ 474±0.′′007 at a PA of 231. °51±0. °11. Including this new epoch in a proper motion analysis, as presented in Fig. 4, clearly showed that the object better agrees with the background trajectory than with being a bound companion.
4.2.6 WASP-8
We re-detected WASP-8 B south of the primary at a separation 4.′′ 520±0.′′005 and with a PA of 170. °9±0. °1. This stellar companion was first detected by Queloz et al. (2010), who classified it as an M-type dwarf. Further studies by Ngo et al. (2015) and Evans et al. (2016a) confirmed the companionship status by common proper motion at more than 5σ significance. This was consolidated by additional Gaia DR2 astrometric measurements, which provide parallaxes of 11.09 ± 0.04 mas and 11.02 ± 0.04 mas as well as proper motions of  mas per year
  mas per year for primary A and secondary B, respectively.
4.2.7 WASP-20
Using the same SPHERE data as presented in this article, Evans et al. (2016b) reported the detection of a bright close-in binary to WASP-20. Our new evaluation of these data showed, however, that the companion’s position angle given in Evans et al. (2016b) is not correct. We found this to be because Evans et al. (2016b) treated the data as being collected in field-stabilised imaging mode, whereas it was actually obtained in pupil-stabilised mode. Our new analysis of the data yielded measurements of the separation and magnitude contrast that agree within the uncertainties with the values derived by Evans et al. (2016b); the correct position angle of WASP-20 B is 216. °0±0. °6.
Furthermore, we inferred a slightly higher effective temperature estimate for WASP-20 B that is, however, consistent within the uncertainties with the value of 5060 ± 250 K as presentedin Evans et al. (2016b). This discrepancy can be explained by the ATLAS9 (Castelli & Kurucz 1994) models usedby Evans et al. (2016b) in comparison to the more recent BT-Settl models that we used instead. Unfortunately, no precise parallax measurement of the host was provided by Gaia DR2, probably because of the binary nature of the system. This resulted in the rather large uncertainties in effective temperature as presented in Table 2, which may be constrained by better distance estimates based on future Gaia data releases.
Because the object was only observed in a single epoch, Evans et al. (2016b) were unable to assess the common proper motion. Furthermore, the CC is not detected in Gaia DR2, therefore we evaluated the companionship with TRILEGAL instead. This analysis provided a probability of 0.004% for the CC to be a background contaminant.
4.2.8 WASP-54
A companion candidate around WASP-54 was first detected by Evans et al. (2016a). Further proper motion analysis presented in Evans et al. (2018) led to the preliminary conclusion that the object is a bound companion. The authors stated, however, that additional measurements are required to confirm this hypothesis.
We combined the data presented in Evans et al. (2016a) and Evans et al. (2018) with the latest SPHERE epoch and additional astrometric data from Gaia DR2. The latter only provided coordinates of the CC and no proper motion that could be used to confirm its companionship. In Fig. 5 we analyse these data in a proper motion diagram.
The data presented in Evans et al. (2016a) consist of five individual epochs obtained in 2014 May. The individual measurements had an intrinsic scatter larger than the provided uncertainties. For this reason, we averagedthe single measurements using the standard deviation of the datapoints as an uncertainty of the combined measurement. One of these datapoints, obtained on 2014 April 18, deviated by more than 3σ from the average of the remaining measurements. We therefore removed this datapoint from our combined astrometry solution for this first epoch.
Evans et al. (2018) presented two additional epochs, 2015 April 29 and 2016 May 3. As shown in Fig. 5, the first of these epochs agrees well with the expected position of a static background object. The second epoch, however, assigns the companion a position in the opposite direction as expected from a background object. Because both epochs do not agree within their uncertainties, it is likely that the results of Evans et al. (2018) were subject to a source of systematic error that was not accounted for in the quoted uncertainties.
No clear conclusion could be drawn from these data alone, but adding Gaia and our latest SPHERE measurements facilitated an unambiguous classification of the potential companion. Both additional datapoints were not compatible with the trajectory of a static background object but are consistent with a co-moving companion. Therefore we conclude that WASP-54 B is a stellar binary to WASP 54 A. From our Ks-band photometry we derived a mass of  M⊙.
M⊙.
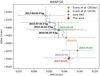 |
Fig. 5 Proper motion analysis of CC 1 around WASP-54. The first measurement from Evans et al. (2016a) (orange circle) is the average of four individual epochs, collected from 2014 May 6 until May 8. The dashed blue line represents the trajectory of a static background (bg) object. |
4.2.9 WASP-68
Candidate companion 1 presented in Evans et al. (2018), at a separation of approximately 13.′′1 and with a position angle of 119. °7, was confirmed as a co-moving stellar companion by Gaia DR2 parallaxes of 4.39 ± 0.03 mas and 4.19 ± 0.15 mas for primary and secondary, respectively. Additional proper motion measurements of  mas per year
  mas per year strengthened the claim that the CC is WASP-68 B, a stellar companion to WASP-68 A. However, we did not detect any CCs around WASP-68 within the IRDIS field of view.
4.2.10 WASP-70
A K3 stellar companion was found to exoplanet host WASP-70 by Anderson et al. (2014a), and we also detected the object in our SPHERE data. Previous studies (e.g. Wöllert & Brandner 2015; Evans et al. 2016a, 2018) stated a common proper motion of the companion at 5σ significance. This was also confirmed by Gaia DR2, which provided parallaxes of 4.47 ± 0.06 mas and 4.35 ± 0.03 mas as well as proper motions of  mas per year
  mas per year. From our Ks -band photometry we derived a mass of
  M⊙ for WASP-70 B.
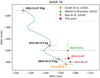 |
Fig. 6 Proper motion analysis of CC 1 around WASP-76. The dashed blue line represents the trajectory of a static background (bg) object. |
4.2.11 WASP-72
We detected a CC to WASP-72 at a separation of 0.′′ 639±0.′′003 and a position angle of 331. °9±0. °3 that was previously unknown. By stellar population synthesis models we derived a probability of 0.02% that the CC is an unassociated background or foreground object. For the case of confirmed common proper motion, we calculated a mass estimate of  M⊙.
M⊙.
4.2.12 WASP-76
We re-detected the stellar CC to WASP-76 that was first detected by Wöllert & Brandner (2015). Follow-up studies led by Ginski et al. (2016) and Ngo et al. (2016) suggested that the companion shows common proper motions with its host. We confirmed this trend with our additional SPHERE epoch as presented in Fig. 6; a background object could be ruled out at 5σ significance. For the stellar companion WASP-76 B we estimated a mass of  M⊙ based on our Ks-band photometry.
4.2.13 WASP-80
We report the detection of a new CC around WASP-80 at a separation of 2.′′ 132±0.′′010 and a position angle of 275. °5±0. °3. Although the system was explored by previous studies of Wöllert & Brandner (2015), and Evans et al. (2016a, 2018) no CCs were revealed by these programs. This is in good agreement with the large magnitude contrast of 9.25± 0.28 mag at which we detected the companion just above the noise level. This is below the detection threshold of previous surveys, which explains why it remained previously undetected. From our TRILEGAL analysis we derived a probability of 3.29% that the CC is not associated with WASP-80. Assuming the object is gravitationally bound to the exoplanet host, we estimated a mass of  M⊙ based on the Ks magnitude.
4.2.14 WASP-87
In the discovery paper reporting a hot Jupiter around WASP-87, Anderson et al. (2014b) also detected a potential stellar companion south-east of the star at a separation of 8.′′2. Evans et al. (2018) suggested that the proper motion analysis presented in Anderson et al. (2014b) based on UCAC4 data (Zacharias et al. 2013) is not supported by other catalogues. Based on its colour, Evans et al. (2018) concluded that the two components are nevertheless bound. This assumption was confirmed by Gaia DR2 parallaxes of 3.32 ± 0.04 mas and 3.19 ± 0.04 mas for WASP-87 A and WASP-87 B, respectively. Furthermore, the proper motions of  mas per year and
  mas per year were absolutely compatible with a gravitationally bound binary system.
Within the IRDIS field of view, we detected two additional point sources south-east of the star. Both were also detected by Gaia DR2, but the catalogue provided a parallax estimate only for CC 2, whereas only the celestial position was measured for CC 1. Based on the parallax measurement of 0.02 ± 0.14 mas for CC 2, we clearly confirm this object as a background source. Because for CC 1 only the position was provided by Gaia DR2, we performed a common proper motion analysis as presented in Fig. 7.
This analysis placed CC 1 close to the expected position of a stationary background object. Because of the large magnitude contrast of CC 1, however, the SPHERE detection was only marginal. Therefore the uncertainties of the derived astrometric precision were too large to either confirm CC 1 as a co-moving companion or to show that it is a background object. Our TRILEGAL analysis provided a probability of 19.83% that CC 1 is not associated with WASP-87.
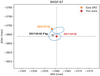 |
Fig. 7 Proper motion analysis of CC 1 around WASP-87. The dashed blue line represents the trajectory of a static background (bg) object. |
4.2.15 WASP-88
We report the detection of a new CC north of WASP-88. It is rather faint, with a magnitude contrast of 7.60± 0.53 mag. From our stellar population synthesis model analysis, we derived a probability of 1.65% that this CC is a background object and not bound to WASP-88.
4.2.16 WASP-108
The system was explored within the scope of one previous multiplicity study of exoplanet host stars (Evans et al. 2018). Evans and collaborators reported several CCs, but the colours of only two of them are consistent with being bound to the planet host star. Because WASP-108 lies within a crowded field, Evans et al. (2018) did not rule out the possibility that both sources are background stars. Instead they explicitly stated the necessity of additional tests. Evans et al. (2018) estimated that the first object at 19.′′ 4563 to the north-east is likely to be background, based on differing proper motion from the host reported in UCAC4, NOMAD, and PPMXL catalogues. This was confirmed by the latest Gaia astrometry, which provided a parallax of 0.18± 0.03 mas, which contradicts the measured value for WASP-108 itself of 3.84 ± 0.05 mas. For the second CC discussed by Evans et al. (2018), no proper motion data were available at the time of their analysis. The latest Gaia astrometry proved that the object is in good agreement with a co-moving companion. Gaia Collaboration (2018) reported a parallax of 2.93 ± 0.47 mas for the companion. to which we refer as WASP-108 B henceforth. The proper motions of  mas per year and
  mas per year also confirmed the hypothesis that this is a gravitationally bound binary.
In addition, we found two CCs within the IRDIS field of view. CC 1 is very close to WASP-108 at a magnitude contrast of ΔKs = 3.90 ± 0.06 mag. Because of its proximity it is likely to be gravitationally bound to the primary. This agrees very well with our TRILEGAL analysis, which provided a probability of 0.02% that CC 1 is rather an unrelated background or foreground contaminant. The second CC in the IRDIS data was detected south of the star at a separation of 5.′′ 039±0.′′005. We performed a proper motion check based on Gaia DR2 and our SPHERE data as presented in Fig. 8. This analysis indicated that CC 2 is compatible with a background object that has a non-zero proper motion; this hypothesis was supported by a background probability of 32.82% based on our TRILEGAL analysis. Because of the large uncertainties in the SPHERE astrometry, however, further tests are necessary to confirm this theory.
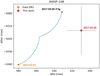 |
Fig. 8 Proper motion analysis of CC 2 around WASP-108. The dashed blue line represents the trajectory of a static background (bg) object. |
4.2.17 WASP-111
In the IRDIS data we re-detected the companion that was first identified by Evans et al. (2018) east of WASP-111 at a separation of 5.′′ 039±0.′′005. Gaia DR2 data confirmed that the companion is bound because WASP-111 A and WASP-111 B were measured to be co-moving with  mas per year and
  mas per year, and they are co-distant with parallaxes of 3.33 ± 0.07 mas and 3.39 ± 0.07 mas.
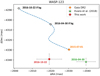 |
Fig. 9 Proper motion analysis of CC 1 around WASP-123. The dashed blue line represents the trajectory of a static background (bg) object. |
4.2.18 WASP-118
We detected a new CC around WASP-118 at a separation of 1.′′ 251±0.′′004 and with a position angle of 246. °5±0. °2. TRILEGALanalysis provided a probability of 0.09% that this CC is not associated with WASP-118. For the case that the CC is actually gravitationally bound to the host, we derived a mass of  .
.
4.2.19 WASP-120
The IRDIS data revealed a potential binary companion east of WASP-120 at a separation of approximately 2.′′ 2. Our simulated stellar population around the position of the primary predicted background probabilities of 0.47 and 0.51% for CC 1 and 2, respectively. This supports the hypothesis that WASP-120 is a hierarchical triple system WASP-120 ABC. Further astrometric measurements are required to confirm this theory.
4.2.20 WASP-122
We detected a new CC north of WASP-122 at a separation of approximately 0.′′ 8. The TRILEGAL analysis yielded a probability of 0.50% that this CC is not associated with the exoplanet host star. We derived a mass estimate of  M⊙ for the case that the CC is actually co-moving with WASP-122.
4.2.21 WASP-123
Evans et al. (2018) detected a CC south of WASP-123 at a separation of 4.′′ 8 that is marginally consistent with a bound object based on its colour. No conclusive result was presented whether this companion is co-moving. By combining the data from Evans et al. (2018), Gaia DR2 astrometry, and our IRDIS data, we analysed the proper motion of the CC as presented in Fig. 9. This clearly demonstrates that the CC is not compatible with a stationary background object with a significance greater than 5σ. Therefore we conclude that the CC is actually WASP-123 B, a stellar companion to WASP-123 A with a mass of approximately  M⊙.
M⊙.
4.2.22 WASP-130
We detected a bright CC east of WASP-130 at a separation of 0.′′ 6. Although the target was also included in previous exoplanet host star multiplicity surveys, no companion was detected by any of these (Evans et al. 2018). The TRILEGAL analysis yielded a probability of 0.22% that this CC is a background or foreground contaminant. Assuming the object is gravitationally bound to WASP-130, we derived a mass estimate of  M⊙.
M⊙.
4.2.23 WASP-131
We detected a very close-in CC to WASP-131 at a separation of 0.′′ 189±0.003 and with a position angle of 111. °5±0. °9 that had not been detected by any previous surveys. Due to the proximity and no other objects in the field of view, it is very likely to orbit the primary. This assumption is in good agreement with a background probability of only 0.01%, which is based on our synthetic stellar population models around the host. If confirmed, WASP-131 B, would be a stellar companion with a mass of  M⊙.
M⊙.
4.2.24 WASP-137
We report the first detection of a CC south of WASP-137. Our TRILEGAL analysis suggested a probability of only 0.14% that this object is not associated with the exoplanet host. From the Ks -band photometry, we estimated a mass of  M⊙ for the CC, assuming it is gravitationally associated.
4.2.25 Non-detection of confirmed companions
Because the IRDIS field of view is limited to approximately 5.′′ 5 in radial separation, some companions to stars from our sample were not detected within the scope of this survey. These confirmed multiple systems are K2-02 (Vanderburg et al. 2015; Evans et al. 2018) and WASP-94 (Neveu-VanMalle et al. 2014; Evans et al. 2018). Furthermore, we could confirm previous CCs outside the IRDIS field of view around WASP-68 (Evans et al. 2018, and Sect. 4.2.9 of this work), WASP-87 (Evans et al. 2018, and Sect. 4.2.14 of this work), and WASP-108 (Evans et al. 2018, and Sect. 4.2.16 of this work) as actual co-moving companions based on Gaia DR2 astrometry.
4.3 Multiplicity rate
For our sample of 45 observed exoplanet host stars, we reported 9 targets (HAT-P-41, HAT-P-57, WASP-2, WASP-8, WASP-54, WASP-70, WASP-76, WASP-111, and WASP-123) that harbour at least one companion within the IRDIS field of view that shows clear common proper motion with the primary from several epochs of observations. Furthermore, 5 additional stars from the sample were confirmed multiple systems with binary components lying outside the IRDIS field of view: the confirmation of these binaries was either performed by previous studies (K2-2 and WASP-94) or by evaluation of Gaia DR2 astrometric measurements for former CCs within this work (WASP-68, WASP-87, and WASP-108). In addition, wefound 12 systems that show ambiguous CCs, where future checks to prove common proper motion at 5σ significance are necessary3 (K2-38, WASP-20, WASP-72, WASP-80, WASP-87, WASP-88, WASP-118, WASP-120, WASP-122, WASP-130, WASP-131, and WASP-137).
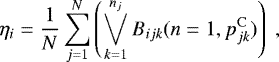
We simulated the stellar multiplicity rate of the exoplanet host stars in our sample as
 (3)
(3)
where i describes the index of the simulation (to be repeated 106 times), N denotes the sample size of 45 exoplanet host stars, nj is the number of CCs around target j, and Bijk describes a draw from a binomial distribution with n = 1 and  , where the latter refers to the probability that CC k around target j is actually bound to its host. CCs that were confirmed to be gravitationally bound (labelled “C” in Table 2 plus five additional confirmed companions outside the IRDIS field of view) were assigned pC = 1. Targets without any CCs or CCs that were proven to be background were assigned pC = 0, accordingly. The remaining ambiguous cases were assigned pC = 1 − pB, with pB denoting the previously determined probability of being a background contaminant based on our TRILEGAL analysis (Eq. (1)).
The outcome of Bijk is either 0 or 1, therefore we calculated the logical disjunction over all CCs of an individual target to simulate whether this host is part of a multiple system. Making 106 independent draws for each CC and accounting for the sample size of N = 45 resulted in a multiplicity rate of  . The uncertainties were obtained as the 68% confidence level around the average of the simulated ηi. However, this analysis only addresses the statistical errors that might occur due to our inconclusive characterisation of some CCs and the limited size of the sample. Of course there might be other intrinsic biases caused by sample selection, or size of the used field of view, that were not considered in this multiplicity estimate.
4.4 Detection limits
To assess the sensitivity we achieved around each target as a function of angular separation, we estimated the contrast in our reduced IRDIS images. For this purpose, we used the non-coronagraphic flux frames and fitted a two-dimensional Gaussian function to the unsaturated PSF. We took the best-fit amplitude of this function as an estimate of the stellar flux and scaled it to account for exposure time difference to the science images and attenuation by potential neutral density filters. The noise was estimated directly from the post-processed coronagraphic images in radial annuli with a width of 55 mas. The annuli were centred around the position of the star behind the coronagraphic mask, and we chose 100 discrete steps of equidistant radii, growing from the inner working angle of approximately 100 mas (Wilby et al., in prep.) up to the edge of the detector. Afterwards, we determined the standard deviation inside each annulus to obtain an estimate for the noise as a function of separation.
For HAT-P-57, where two epochs of the target were obtained, we continued analysing just the slightly deeper contrast that was obtained on the night of 2016 October 9. The 5σ detection limits for all datasets are presented in Fig. 10.
The spread in contrast performance between different datasets can be explained by the strongly varying atmospheric conditions for different observations of the programme as presented in Table A.1. On average we reached a magnitude contrast of 7.0 ± 0.8 mag at a separation of 200 mas, and we were background limited with an average magnitude contrast of 8.9 ± 0.9 mag at separations larger than 1′′. Because of the missing sky frames and the imperfect background subtraction, a slight decrease of the contrast performance was observed for all datasets. This was the case for separations larger than 3′′ and the strength of the effect in of the order of half a magnitude. The detailed contrast performance for each individual target evaluated at discrete separations of 0.′′2, 0.′′ 5, 1.′′ 0, 2.′′ 0, and 5.′′ 0 is presented inTable 3.
We converted the magnitude contrast into mass limits by the same metric as illustrated in Sect. 4.2 using AMES-Cond, AMES-Dusty, and BT-Settl models (Allard et al. 2001; Baraffe et al. 2003). The corresponding contrast curves for each individual target are presented in Appendix B.
For almost all targets within the sample we were sensitive to stellar companions with masses higher than 0.1M⊙ at separations larger than 0.′′5, and for most of them we even reached the threshold to the regime of brown dwarfs around 0.08M⊙. In the five cases where we did not achieve this sensitivity, this was caused by the large distances to the corresponding targets of more than 350 pc and/or poor AO conditions. It is clear that the sensitivity achieved in only 256 s of integration with SPHERE in mediocre conditions outperformed similar studies based on lucky imaging or conducted with other AO-assisted instruments.
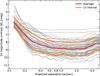 |
Fig. 10 Detection limits of our SPHERE survey for detection of stellar companions to known exoplanet host stars. Thegrey lines represent all individual targets and epochs as presented in Table A.1, and thered curve and orange curves indicate the average contrast performance and the corresponding 1σ interval. |
5 Discussion
5.1 Multiplicity rate
We derived a multiplicity rate of  from our sample of exoplanet host stars. This value seems to be higher than estimates of many previous near-infrared surveys targeting transiting exoplanet host stars to search for stellar companions, which derive multiplicity fractions of 21 ± 12% (Daemgen et al. 2009), 38 ± 15% (Faedi et al. 2013b), 29 ± 12% (Bergfors et al. 2013), and 33 ± 15% (Adams et al. 2013) among their samples. Although the sample sizes of these studies were considerably smaller than the number of targets studied within the scope of this survey, this discrepancy in multiplicity rates most likely originates from the incompleteness of these previous surveys. As most of these programmes were carried out using lucky-imaging strategies or with the first generation of AO-assisted imagers, the sensitivity achieved at small separation to the host stars was lower than that achievable with SPHERE. A more accurate assessment of this incompleteness was presented by Ngo et al. (2015), who derived a raw multiplicity fraction of 34 ± 7% for their sample of 50 transiting exoplanet hosts. After simulating the population of binaries that were missed because of the instrument sensitivity and limited field of view, they presented a corrected fraction of 49 ± 9% instead. This value agrees very well with the rate derived from our sample because we already considered previously detected companions outside of the SPHERE field of view for the statistical analysis.
5.2 Hot Jupiter host stars
A large sub-sample of the targets studied within this survey are host stars to transiting hot Jupiters. To study all stars from our sample that harbour giant planets with masses higher than 0.1 Mjup and semi-major axes smaller than 0.1 au, we only needed to dismiss K2-2, K2-24, K2-38, K2-99, and WASP-130 from the original set. Reiterating the analysis as described in Sect. 4.3 provided a multiplicity rate of  for this sub-sample of hot Jupiter hosts. Consequently, we aimed to assess whether this sub-sample of 40 targets is representative for the general population of host Jupiter host stars.
As described in Sect. 1, our target selection was purely restricted by the position on sky because we required the objects to be observable with the VLT, and the targets’ R-band magnitude to enable AO-assisted imaging. All hot Jupiter host stars that met these criteria were observed within this survey, even if they had been considered in previous studies. To further evaluate the quality of our sub-sample, we compiled a control group of 366 objects from the Exoplanet Orbit Database (Han et al. 2014), considering all hosts to transiting planets with masses higher than 0.1 Mjup and semi-major axes smaller than 0.1 au. We compared our sub-sample of hot Jupiters to the control group using six observables, of which three describe properties of the hosts and three characterise the transiting giant planets. These parameters are the stellar masses M⋆, stellar radii R⋆, effective temperatures Teff, planetary masses Mp, planetary radii Rp, and orbital periods P. In Fig. 11 we present the relative frequency distributions of these observables among control group and targets used for this study.
There seems to be a trend towards slightly higher mass stars in our sample with respect to the general population of hot Jupiter hosts. This agrees well with the applied magnitude cutoff, which induces a marginal bias towards brighter and thus more massive host stars. The same trend is marginally detected for the planetary properties as well. Nevertheless, the distributions of all observables presented in Fig. 11 agree well between our sample and the control group, and the 68% confidence intervals we determined for both samples intersect significantly for each of the parameter distributions. We therefore argue that the targets analysed within the scope of this study can be considered a good representation of typical hot Jupiter systems.
5.3 Correlation between stellar multiplicity and exoplanet eccentricities
Nine systems in our sample harbour a transiting exoplanet that shows a non-zero eccentricity. To test theories on the formation of these particular systems, we evaluated the multiplicity rates among these environments and in comparison to the systems that do not have any known eccentric transiting planets. For this purpose, we repeated the analysis from Sect. 4.3 for the two sub-samples of eccentric and non-eccentric planet host stars. From this analysis we obtained multiplicity rates of  and
and  for the systems that host eccentric planetary companions and those that do not, respectively. The large uncertainties on especially the first value arise from the very limited sample size of nine systems with the required properties. Nevertheless, there is no statistically significant difference between the multiplicity rates amongst eccentric and non-eccentric sub-samples. This agrees well with previous results from Ngo et al. (2015, 2017).
Contrast performance for all datasets evaluated at discrete separations.
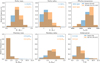 |
Fig. 11 Histograms of hot Jupiter (HJ) system properties. We compare the targets analysed within the scope of this study (orange bars) to a general sample of hot Jupiter environments (blue bars). Top panel: relative frequency distributions of stellar masses M⋆, radii R⋆, and effective temperatures Teff amongst both samples. Lower panel: properties of the transiting companions such as planetary masses Mp, planetary radii Rp, and orbital periods P. In the upper part of each plot, we present the 68% confidence intervals around the medians of the corresponding distributions. |
6 Conclusions
We have observed a sample of 45 transiting exoplanet host stars with VLT/SPHERE/IRDIS to search for stellar companions. Our results are listed below.
-
We detected 11 CCs that had been identified by previous studies around 10 targets of our sample. For these CCs, we were able to confirm 9 as co-moving binaries with common proper motion, proving HAT-P-41, HAT-P-57, WASP-2, WASP-8, WASP-54, WASP-70, WASP-76, and WASP-111 to be multiple systems. One candidate around WASP-7 has been confirmed to be a background object. The status of a very bright and close companion to WASP-20 is still ambiguous because only one epoch of astrometric data was available. Synthetic stellar population models, however, suggest that WASP-20 B is a gravitationally bound binary, which is in agreement with the conclusions from Evans et al. (2016b).
-
We detected 16 candidates that have not been reported by previous studies. These candidates are distributed among 13 different systems. By combining SPHERE and Gaia astrometry, we were able to show that WASP-123 is a binary system, whereas we could prove CCs around WASP-87 (CC 2) and WASP-108 (CC 2) to be background objects. For new CCs detected around K2-38, WASP-72, WASP-80, WASP-88, WASP-108 (CC 1), WASP-118, WASP-120, WASP-122, WASP-120, WASP-131, and WASP-137 too few astrometric measurements were available to prove common proper motion at 5σ significance. Based on stellar population synthesis models, we derived the probability that the candidates are instead background contaminants. The most promising candidates with background probabilities lower than 0.1% were detected around WASP-131, WASP-72, and WASP-118.
-
Additional proper motion checks need to be performed to test the companionship of these newly identified candidates and WASP-20 B.
-
We derived detection limits for all of our targets and showed that we reach an average magnitude contrast of 7.0 ± 0.8 mag at a separation of 0.′′2, while we were background limited for separations about 1.′′0 with an average magnitude contrast of 8.9 ± 0.9 mag. For each individual target we converted the derived contrast into a threshold of detectable mass by applying AMES-Cond, AMES-Dusty, and BT-Settl models depending on the effective temperature of the object. For 40 targets, we were able to exclude companions with masses higher than 0.1M⊙ for separations that are larger than 0.′′5, and in 20 cases we reached the lower mass limit for potential stellar companions of approximately 0.08M⊙.
-
Based onour results, we derived a stellar multiplicity rate of
 among our sample, which agrees well with results from previous surveys. For the representative sub-sample of 40 host stars to transiting hot Jupiters, the derived multiplicity fraction is
  .
. -
We did not detect any correlation between the multiplicity of stellar systems and the eccentricity of planets that are detectedaround these stars.
We have shown that SPHERE is a great instrument for carrying out studies like this. The precision of the Gaia mission, especially the claimed performance of future data releases, is also a valuable tool to find stellar companions to exoplanet host stars.
In a companion work (Southworth et al. 2020) we will revisit the systems for which we have identified relatively bright nearby companions in the current work. We will use new and existing photometric and spectroscopic observations to redetermine the properties of the systems, corrected for the light contributed by the nearby companion stars.
Acknowledgements
We thank the anonymous referee for the feedback that helped improving he quality of the manuscript. The research of A.J.B. and F.S. leading to these results has received funding from the European Research Council under ERC Starting Grant agreement 678194 (FALCONER). This research has made use of the Exoplanet Orbit Database and the Exoplanet Data Explorer at http://www.exoplanets.org/. To achieve the scientific results presented in this article we used the Python programming language4, especially the SciPy (Jones et al. 2001), NumPy (Oliphant 2006), Matplotlib (Hunter 2007), scikit-image (Van der Walt et al. 2014), scikit-learn (Pedregosa et al. 2012), photutils (Bradley et al. 2016), and astropy (Astropy Collaboration 2013, 2018) packages.
Appendix A Observational setup
The detailed observational setup and the weather conditions of the individual observations are presented in Table A.1.
Observational setup and weather conditions for all acquired data.
Appendix B Individual detection limits
The detection limits for each individual target are presented in Figs. B.1–B.3. We used AMES-Cond, AMES-Dusty, and BT-Settl models (Allard et al. 2001; Baraffe et al. 2003) as illustrated in Sect. 4.2 to convert magnitude contrast into detectable Jupiter masses. The data used for creating these plots will be published at CDS.
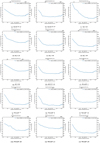 |
Fig. B.1 Detection limits of individual targets I. We convert projected angular separations into projected physical separations using the distances presented in Table 1. The mass limits arise from comparison to AMES-Cond, AMES-Dusty, and BT-Settl models as described in Sect. 4.2. |
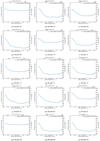 |
Fig. B.2 Detection limits of individual targets II. We convert projected angular separations into projected physical separations using the distances presented in Table 1. The mass limits arise from comparison to AMES-Cond, AMES-Dusty, and BT-Settl models as described in Sect. 4.2. |
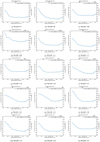 |
Fig. B.3 Detection limits of individual targets III. We convert projected angular separations into projected physical separations using the distances presented in Table 1. The mass limits arise from comparison to AMES-Cond, AMES-Dusty, and BT-Settl models as described in Sect. 4.2. |
References
- Adams, E. R., Dupree, A. K., Kulesa, C., & McCarthy, D. 2013, AJ, 146, 9 [NASA ADS] [CrossRef] [Google Scholar]
- Allard, F., Hauschildt, P. H., Alexander, D. R., Tamanai, A., & Schweitzer, A. 2001, ApJ, 556, 357 [NASA ADS] [CrossRef] [Google Scholar]
- Anderson, D. R., Collier Cameron, A., Hellier, C., et al. 2011, ApJ, 726, L19 [NASA ADS] [CrossRef] [Google Scholar]
- Anderson, D. R., Collier Cameron, A., Delrez, L., et al. 2014a, MNRAS, 445, 1114 [NASA ADS] [CrossRef] [Google Scholar]
- Anderson, D. R., Brown, D. J. A., Collier Cameron, A., et al. 2014b, MNRAS, submitted [arXiv:1410.3449] [Google Scholar]
- Anderson, D. R., Bouchy, F., Brown, D. J. A., et al. 2014c, ArXiv e-prints [arXiv:1812.09264] [Google Scholar]
- Astropy Collaboration (Robitaille, T. P., et al.) 2013, A&A, 558, A33 [NASA ADS] [CrossRef] [EDP Sciences] [Google Scholar]
- Astropy Collaboration (Price-Whelan, A. M., et al.) 2018, AJ, 156, 123 [Google Scholar]
- Auvergne, M., Bodin, P., Boisnard, L., et al. 2009, A&A, 506, 411 [NASA ADS] [CrossRef] [EDP Sciences] [Google Scholar]
- Bailer-Jones, C. A. L., Rybizki, J., Fouesneau, M., Mantelet, G., & Andrae, R. 2018, AJ, 156, 58 [NASA ADS] [CrossRef] [Google Scholar]
- Bakos, G., Noyes, R. W., Kovács, G., et al. 2004, PASP, 116, 266 [NASA ADS] [CrossRef] [Google Scholar]
- Baraffe, I., Chabrier, G., Barman, T. S., Allard, F., & Hauschildt, P. H. 2003, A&A, 402, 701 [NASA ADS] [CrossRef] [EDP Sciences] [Google Scholar]
- Baranne, A., Queloz, D., Mayor, M., et al. 1996, A&AS, 119, 373 [NASA ADS] [CrossRef] [EDP Sciences] [Google Scholar]
- Batygin, K. 2012, Nature, 491, 418 [NASA ADS] [CrossRef] [PubMed] [Google Scholar]
- Batygin, K., Bodenheimer, P. H., & Laughlin, G. P. 2016, ApJ, 829, 114 [NASA ADS] [CrossRef] [Google Scholar]
- Bergfors, C., Brandner, W., Daemgen, S., et al. 2013, MNRAS, 428, 182 [NASA ADS] [CrossRef] [Google Scholar]
- Beuzit, J. L., Vigan, A., Mouillet, D., et al. 2019, A&A, 631, A155 [NASA ADS] [CrossRef] [EDP Sciences] [Google Scholar]
- Bodenheimer, P., Hubickyj, O., & Lissauer, J. J. 2000, Icarus, 143, 2 [NASA ADS] [CrossRef] [Google Scholar]
- Boley, A. C., Granados Contreras, A. P., & Gladman, B. 2016, ApJ, 817, L17 [NASA ADS] [CrossRef] [Google Scholar]
- Borucki, W. J., Koch, D., Basri, G., et al. 2010, Science, 327, 977 [NASA ADS] [CrossRef] [PubMed] [Google Scholar]
- Bouchy, F., Hebb, L., Skillen, I., et al. 2010, A&A, 519, A98 [NASA ADS] [CrossRef] [EDP Sciences] [Google Scholar]
- Bradley, L., Sipocz, B., Robitaille, T., et al. 2016, Astrophysics Source Code Library [record ascl:1609.011] [Google Scholar]
- Brown, D. J. A., Triaud, A. H. M. J., Doyle, A. P., et al. 2017, MNRAS, 464, 810 [NASA ADS] [CrossRef] [Google Scholar]
- Butler, R. P., Marcy, G. W., Williams, E., Hauser, H., & Shirts, P. 1997, ApJ, 474, L115 [NASA ADS] [CrossRef] [Google Scholar]
- Carbillet, M., Bendjoya, P., Abe, L., et al. 2011, Exp. Astron., 30, 39 [NASA ADS] [CrossRef] [Google Scholar]
- Castelli, F., & Kurucz, R. L. 1994, A&A, 281, 817 [NASA ADS] [Google Scholar]
- Chatterjee, S., Ford, E. B., Matsumura, S., & Rasio, F. A. 2008, ApJ, 686, 580 [NASA ADS] [CrossRef] [Google Scholar]
- Ciceri, S., Mancini, L., Southworth, J., et al. 2013, A&A, 557, A30 [NASA ADS] [CrossRef] [EDP Sciences] [Google Scholar]
- Claudi, R. U., Turatto, M., Gratton, R. G., et al. 2008, SPIE Conf. Ser., 7014, 70143E [Google Scholar]
- Collier Cameron, A., Bouchy, F., Hébrard, G., et al. 2007, MNRAS, 375, 951 [NASA ADS] [CrossRef] [Google Scholar]
- Cosentino, R., Lovis, C., Pepe, F., et al. 2012, SPIE Conf. Ser., 8446, 84461V [Google Scholar]
- Cutri, R. M., Skrutskie, M. F., van Dyk, S., et al. 2012, VizieR Online Data Catalog: II/281 [Google Scholar]
- Daemgen, S., Hormuth, F., Brandner, W., et al. 2009, A&A, 498, 567 [NASA ADS] [CrossRef] [EDP Sciences] [Google Scholar]
- Delrez, L., Van Grootel, V., Anderson, D. R., et al. 2014, A&A, 563, A143 [NASA ADS] [CrossRef] [EDP Sciences] [Google Scholar]
- Delrez, L., Santerne, A., Almenara, J.-M., et al. 2016, MNRAS, 458, 4025 [NASA ADS] [CrossRef] [Google Scholar]
- Dietrich, J., & Ginski, C. 2018, A&A, 620, A102 [NASA ADS] [CrossRef] [EDP Sciences] [Google Scholar]
- Dohlen, K., Langlois, M., Saisse, M., et al. 2008, Proc. SPIE, 7014, 70143L [Google Scholar]
- Eggleton, P. P., & Kiseleva-Eggleton, L. 2001, ApJ, 562, 1012 [NASA ADS] [CrossRef] [Google Scholar]
- Evans, D. F., Southworth, J., Maxted, P. F. L., et al. 2016a, A&A, 589, A58 [NASA ADS] [CrossRef] [EDP Sciences] [Google Scholar]
- Evans, D. F., Southworth, J., & Smalley, B. 2016b, ApJ, 833, L19 [NASA ADS] [CrossRef] [Google Scholar]
- Evans, D. F., Southworth, J., Smalley, B., et al. 2018, A&A, 610, A20 [NASA ADS] [CrossRef] [EDP Sciences] [Google Scholar]
- Fabrycky, D., & Tremaine, S. 2007, ApJ, 669, 1298 [NASA ADS] [CrossRef] [Google Scholar]
- Faedi, F., Pollacco, D., Barros, S. C. C., et al. 2013a, A&A, 551, A73 [NASA ADS] [CrossRef] [EDP Sciences] [Google Scholar]
- Faedi, F., Staley, T., Gómez Maqueo Chew, Y., et al. 2013b, MNRAS, 433, 2097 [NASA ADS] [CrossRef] [Google Scholar]
- Fienup, J. R. 1997, Appl. Opt., 36, 8352 [NASA ADS] [CrossRef] [Google Scholar]
- Fischer, D. A., Marcy, G. W., Butler, R. P., Vogt, S. S., & Apps, K. 1999, PASP, 111, 50 [NASA ADS] [CrossRef] [Google Scholar]
- Fusco, T., Rousset, G., Sauvage, J.-F., et al. 2006, Opt. Exp., 14, 7515 [Google Scholar]
- Gaia Collaboration (Brown, A. G. A., et al.) 2018, A&A, 616, A1 [NASA ADS] [CrossRef] [EDP Sciences] [Google Scholar]
- Gibson, N. P., Aigrain, S., Barstow, J. K., et al. 2013, MNRAS, 428, 3680 [NASA ADS] [CrossRef] [Google Scholar]
- Gillon, M., Anderson, D. R., Collier-Cameron, A., et al. 2013, A&A, 552, A82 [NASA ADS] [CrossRef] [EDP Sciences] [Google Scholar]
- Ginski, C., Mugrauer, M., Seeliger, M., et al. 2016, MNRAS, 457, 2173 [NASA ADS] [CrossRef] [Google Scholar]
- Girardi, L., Groenewegen, M. A. T., Hatziminaoglou, E., & da Costa, L. 2005, A&A, 436, 895 [NASA ADS] [CrossRef] [EDP Sciences] [Google Scholar]
- Guerri, G., Daban, J.-B., Robbe-Dubois, S., et al. 2011, Exp. Astron., 30, 59 [NASA ADS] [CrossRef] [Google Scholar]
- Guizar-Sicairos, M., Thurman, S. T., & Fienup, J. R. 2008, Opt. Lett., 33, 156 [NASA ADS] [CrossRef] [Google Scholar]
- Han, E., Wang, S. X., Wright, J. T., et al. 2014, PASP, 126, 827 [NASA ADS] [CrossRef] [Google Scholar]
- Hartman, J. D., Bakos, G. Á., Béky, B., et al. 2012, AJ, 144, 139 [NASA ADS] [CrossRef] [Google Scholar]
- Hartman, J. D., Bakos, G. Á., Buchhave, L. A., et al. 2015, AJ, 150, 197 [NASA ADS] [CrossRef] [Google Scholar]
- Hay, K. L., Collier-Cameron, A., Doyle, A. P., et al. 2016, MNRAS, 463, 3276 [NASA ADS] [CrossRef] [Google Scholar]
- Hellier, C., Anderson, D. R., Gillon, M., et al. 2009, ApJ, 690, L89 [NASA ADS] [CrossRef] [Google Scholar]
- Hellier, C., Anderson, D. R., Collier Cameron, A., et al. 2010, ApJ, 723, L60 [NASA ADS] [CrossRef] [Google Scholar]
- Hellier, C., Anderson, D. R., Cameron, A. C., et al. 2014, MNRAS, 440, 1982 [NASA ADS] [CrossRef] [Google Scholar]
- Hellier, C., Anderson, D. R., Collier Cameron, A., et al. 2015, AJ, 150, 18 [NASA ADS] [CrossRef] [Google Scholar]
- Hellier, C., Anderson, D. R., Cameron, A. C., et al. 2017, MNRAS, 465, 3693 [NASA ADS] [CrossRef] [Google Scholar]
- Hunter, J. D. 2007, Comput. Sci. Eng., 9, 90 [NASA ADS] [CrossRef] [Google Scholar]
- Jones, E., Oliphant, T., Peterson, P., et al. 2001, SciPy: Open source scientific tools for Python [Online] [Google Scholar]
- Kley, W., & Nelson, R. P. 2012, ARA&A, 50, 211 [NASA ADS] [CrossRef] [Google Scholar]
- Kuhn, R. B., Rodriguez, J. E., Collins, K. A., et al. 2016, MNRAS, 459, 4281 [NASA ADS] [CrossRef] [Google Scholar]
- Lai, D., Foucart, F., & Lin, D. N. C. 2011, IAU Symp., 276, 295 [NASA ADS] [Google Scholar]
- Lam, K. W. F., Faedi, F., Brown, D. J. A., et al. 2017, A&A, 599, A3 [NASA ADS] [CrossRef] [EDP Sciences] [Google Scholar]
- Law, N. M., Morton, T., Baranec, C., et al. 2014, ApJ, 791, 35 [NASA ADS] [CrossRef] [Google Scholar]
- Lendl, M., Triaud, A. H. M. J., Anderson, D. R., et al. 2014, A&A, 568, A81 [NASA ADS] [CrossRef] [EDP Sciences] [Google Scholar]
- Lillo-Box, J., Barrado, D., & Bouy, H. 2014, A&A, 566, A103 [NASA ADS] [CrossRef] [EDP Sciences] [Google Scholar]
- Lin, D. N. C., Bodenheimer, P., & Richardson, D. C. 1996, Nature, 380, 606 [NASA ADS] [CrossRef] [Google Scholar]
- Lister, T. A., Anderson, D. R., Gillon, M., et al. 2009, ApJ, 703, 752 [NASA ADS] [CrossRef] [Google Scholar]
- Maire, A.-L., Langlois, M., Dohlen, K., et al. 2016, Proc. SPIE, 9908, 990834 [CrossRef] [Google Scholar]
- Mancini, L., Southworth, J., Ciceri, S., et al. 2014, A&A, 562, A126 [NASA ADS] [CrossRef] [EDP Sciences] [Google Scholar]
- Mancini, L., Southworth, J., Mollière, P., et al. 2019, MNRAS, 485, 5168 [NASA ADS] [CrossRef] [Google Scholar]
- Maxted, P. F. L., Serenelli, A. M., & Southworth, J. 2015, A&A, 577, A90 [NASA ADS] [CrossRef] [EDP Sciences] [Google Scholar]
- Mayor, M., & Queloz, D. 1995, Nature, 378, 355 [Google Scholar]
- Mayor, M., Pepe, F., Queloz, D., et al. 2003, The Messenger, 114, 20 [NASA ADS] [Google Scholar]
- Močnik, T., Hellier, C., Anderson, D. R., Clark, B. J. M., & Southworth, J. 2017, MNRAS, 469, 1622 [NASA ADS] [CrossRef] [Google Scholar]
- Nagasawa, M., Ida, S., & Bessho, T. 2008, ApJ, 678, 498 [NASA ADS] [CrossRef] [Google Scholar]
- Neveu-VanMalle, M., Queloz, D., Anderson, D. R., et al. 2014, A&A, 572, A49 [NASA ADS] [CrossRef] [EDP Sciences] [Google Scholar]
- Ngo, H., Knutson, H. A., Hinkley, S., et al. 2015, ApJ, 800, 138 [NASA ADS] [CrossRef] [Google Scholar]
- Ngo, H., Knutson, H. A., Hinkley, S., et al. 2016, ApJ, 827, 8 [NASA ADS] [CrossRef] [Google Scholar]
- Ngo, H., Knutson, H. A., Bryan, M. L., et al. 2017, AJ, 153, 242 [NASA ADS] [CrossRef] [Google Scholar]
- Oliphant, T. E. 2006, A Guide to NumPy (USA: Trelgol Publishing), 1 [Google Scholar]
- Pedregosa, F., Varoquaux, G., Gramfort, A., et al. 2012, ArXiv e-prints [arXiv:1201.0490] [Google Scholar]
- Petigura, E. A., Howard, A. W., Lopez, E. D., et al. 2016, ApJ, 818, 36 [NASA ADS] [CrossRef] [Google Scholar]
- Petigura, E. A., Sinukoff, E., Lopez, E. D., et al. 2017, AJ, 153, 142 [NASA ADS] [CrossRef] [Google Scholar]
- Petigura, E. A., Benneke, B., Batygin, K., et al. 2018, AJ, 156, 89 [NASA ADS] [CrossRef] [Google Scholar]
- Pollacco, D. L., Skillen, I., Collier Cameron, A., et al. 2006, PASP, 118, 1407 [NASA ADS] [CrossRef] [Google Scholar]
- Pollack, J. B., Hubickyj, O., Bodenheimer, P., et al. 1996, Icarus, 124, 62 [NASA ADS] [CrossRef] [Google Scholar]
- Queloz, D., Anderson, D., Collier Cameron, A., et al. 2010, A&A, 517, L1 [NASA ADS] [CrossRef] [EDP Sciences] [Google Scholar]
- Rasio, F. A., & Ford, E. B. 1996, Science, 274, 954 [NASA ADS] [CrossRef] [PubMed] [Google Scholar]
- Serenelli, A. M., Bergemann, M., Ruchti, G., & Casagrande, L. 2013, MNRAS, 429, 3645 [NASA ADS] [CrossRef] [Google Scholar]
- Sinukoff, E., Howard, A. W., Petigura, E. A., et al. 2016, ApJ, 827, 78 [NASA ADS] [CrossRef] [Google Scholar]
- Smith, A. M. S., Anderson, D. R., Bouchy, F., et al. 2013, A&A, 552, A120 [NASA ADS] [CrossRef] [EDP Sciences] [Google Scholar]
- Smith, A. M. S., Gandolfi, D., Barragán, O., et al. 2017, MNRAS, 464, 2708 [NASA ADS] [CrossRef] [Google Scholar]
- Socrates, A., Katz, B., Dong, S., & Tremaine, S. 2012, ApJ, 750, 106 [NASA ADS] [CrossRef] [Google Scholar]
- Soummer, R. 2005, ApJ, 618, L161 [NASA ADS] [CrossRef] [Google Scholar]
- Southworth, J. 2011, MNRAS, 417, 2166 [NASA ADS] [CrossRef] [Google Scholar]
- Southworth, J. 2012, MNRAS, 426, 1291 [NASA ADS] [CrossRef] [Google Scholar]
- Southworth, J., Mancini, L., Browne, P., et al. 2013, MNRAS, 434, 1300 [NASA ADS] [CrossRef] [Google Scholar]
- Southworth, J., Bohn, A., Ginski, C., Kenworthy, M., & Mancini, L. 2020, A&A, 635, A74 [NASA ADS] [CrossRef] [EDP Sciences] [Google Scholar]
- Stolker, T., Bonse, M. J., Quanz, S. P., et al. 2019, A&A, 621, A59 [NASA ADS] [CrossRef] [EDP Sciences] [Google Scholar]
- Triaud, A. H. M. J., Anderson, D. R., Collier Cameron, A., et al. 2013a, A&A, 551, A80 [NASA ADS] [CrossRef] [EDP Sciences] [Google Scholar]
- Triaud, A. H. M. J., Hebb, L., Anderson, D. R., et al. 2013b, A&A, 549, A18 [NASA ADS] [CrossRef] [EDP Sciences] [Google Scholar]
- Turner, O. D., Anderson, D. R., Collier Cameron, A., et al. 2016, PASP, 128, 064401 [NASA ADS] [CrossRef] [Google Scholar]
- Udry, S., & Santos, N. C. 2007, ARA&A, 45, 397 [NASA ADS] [CrossRef] [Google Scholar]
- Van der Walt, S., Schönberger, J. L., Nunez-Iglesias, J., et al. 2014, PeerJ, 2, e453 [CrossRef] [PubMed] [Google Scholar]
- Van Eylen, V., Albrecht, S., Gandolfi, D., et al. 2016, AJ, 152, 143 [NASA ADS] [CrossRef] [Google Scholar]
- Vanderburg, A., Montet, B. T., Johnson, J. A., et al. 2015, ApJ, 800, 59 [NASA ADS] [CrossRef] [Google Scholar]
- Vigan, A., Moutou, C., Langlois, M., et al. 2010, MNRAS, 407, 71 [NASA ADS] [CrossRef] [Google Scholar]
- Winn, J. N., Fabrycky, D., Albrecht, S., & Johnson, J. A. 2010, ApJ, 718, L145 [NASA ADS] [CrossRef] [Google Scholar]
- Wöllert, M., & Brandner, W. 2015, A&A, 579, A129 [NASA ADS] [CrossRef] [EDP Sciences] [Google Scholar]
- Wöllert, M., Brandner, W., Bergfors, C., & Henning, T. 2015, A&A, 575, A23 [NASA ADS] [CrossRef] [EDP Sciences] [Google Scholar]
- Wu, Y., & Lithwick, Y. 2011, ApJ, 735, 109 [Google Scholar]
- Wu, Y., & Murray, N. 2003, ApJ, 589, 605 [NASA ADS] [CrossRef] [EDP Sciences] [Google Scholar]
- Zacharias, N., Finch, C. T., Girard, T. M., et al. 2013, AJ, 145, 44 [NASA ADS] [CrossRef] [EDP Sciences] [Google Scholar]
We present the common proper motion tests in a plot that displays the candidate’s differential offsets in right ascension and declination to the host, henceforth. Using one datapoint as baseline, we simulate the trajectory of a static background object based on the parallax and proper motion of the exoplanet host star. Several measurements of the CC astrometry help to discern whether it is orbiting the primary or a background contaminant.
Python Software Foundation, https://www.python.org/
All Tables
All Figures
|
Fig. 1 Newly detected CCs around transiting exoplanet host stars from the SPHERE/IRDIS data. An unsharp mask was applied to highlight point sources. The origin of the axes is located at the position of the host star. The images are displayed using a logarithmic scale with arbitrary offsets and stretches to highlight the CCs. In all images north points up and east towards the left. The lower left corner of each image shows the reduced non-coronagraphic flux image with the same spatial scale and field orientation. |
| In the text | |
|
Fig. 2 Previously detected CCs around transiting exoplanet host stars from the SPHERE/IRDIS data. An unsharp mask was applied to highlight point sources. The origin of the axes is located at the position of the host star. The images are displayed using a logarithmic scale with arbitrary offsets and stretches to highlight the CCs. In all images north points up and east towards the left. The lower left corner of each image shows the reduced non-coronagraphic flux image with the same spatial scale and field orientation. |
| In the text | |
|
Fig. 3 Proper motion analysis of CC 1 and 2 detected around HAT-P-57. PA and separation are evaluated individually. The dashed cone presents the expected position of a gravitationally bound companion considering potential orbital motion of the object. The grey trajectory represents the expected location of a stationary background object, instead. For the MMT/Clio2data we adopted the separation measurement presented Hartman et al. (2015); no PA of the source at this epoch is provided. |
| In the text | |
|
Fig. 4 Proper motion analysis of CC 1 around WASP-7. The dashed blue line represents the trajectory of a static background (bg) object. |
| In the text | |
|
Fig. 5 Proper motion analysis of CC 1 around WASP-54. The first measurement from Evans et al. (2016a) (orange circle) is the average of four individual epochs, collected from 2014 May 6 until May 8. The dashed blue line represents the trajectory of a static background (bg) object. |
| In the text | |
|
Fig. 6 Proper motion analysis of CC 1 around WASP-76. The dashed blue line represents the trajectory of a static background (bg) object. |
| In the text | |
|
Fig. 7 Proper motion analysis of CC 1 around WASP-87. The dashed blue line represents the trajectory of a static background (bg) object. |
| In the text | |
|
Fig. 8 Proper motion analysis of CC 2 around WASP-108. The dashed blue line represents the trajectory of a static background (bg) object. |
| In the text | |
|
Fig. 9 Proper motion analysis of CC 1 around WASP-123. The dashed blue line represents the trajectory of a static background (bg) object. |
| In the text | |
|
Fig. 10 Detection limits of our SPHERE survey for detection of stellar companions to known exoplanet host stars. Thegrey lines represent all individual targets and epochs as presented in Table A.1, and thered curve and orange curves indicate the average contrast performance and the corresponding 1σ interval. |
| In the text | |
|
Fig. 11 Histograms of hot Jupiter (HJ) system properties. We compare the targets analysed within the scope of this study (orange bars) to a general sample of hot Jupiter environments (blue bars). Top panel: relative frequency distributions of stellar masses M⋆, radii R⋆, and effective temperatures Teff amongst both samples. Lower panel: properties of the transiting companions such as planetary masses Mp, planetary radii Rp, and orbital periods P. In the upper part of each plot, we present the 68% confidence intervals around the medians of the corresponding distributions. |
| In the text | |
|
Fig. B.1 Detection limits of individual targets I. We convert projected angular separations into projected physical separations using the distances presented in Table 1. The mass limits arise from comparison to AMES-Cond, AMES-Dusty, and BT-Settl models as described in Sect. 4.2. |
| In the text | |
|
Fig. B.2 Detection limits of individual targets II. We convert projected angular separations into projected physical separations using the distances presented in Table 1. The mass limits arise from comparison to AMES-Cond, AMES-Dusty, and BT-Settl models as described in Sect. 4.2. |
| In the text | |
|
Fig. B.3 Detection limits of individual targets III. We convert projected angular separations into projected physical separations using the distances presented in Table 1. The mass limits arise from comparison to AMES-Cond, AMES-Dusty, and BT-Settl models as described in Sect. 4.2. |
| In the text | |
Current usage metrics show cumulative count of Article Views (full-text article views including HTML views, PDF and ePub downloads, according to the available data) and Abstracts Views on Vision4Press platform.
Data correspond to usage on the plateform after 2015. The current usage metrics is available 48-96 hours after online publication and is updated daily on week days.
Initial download of the metrics may take a while.