Free Access
Fig. 10
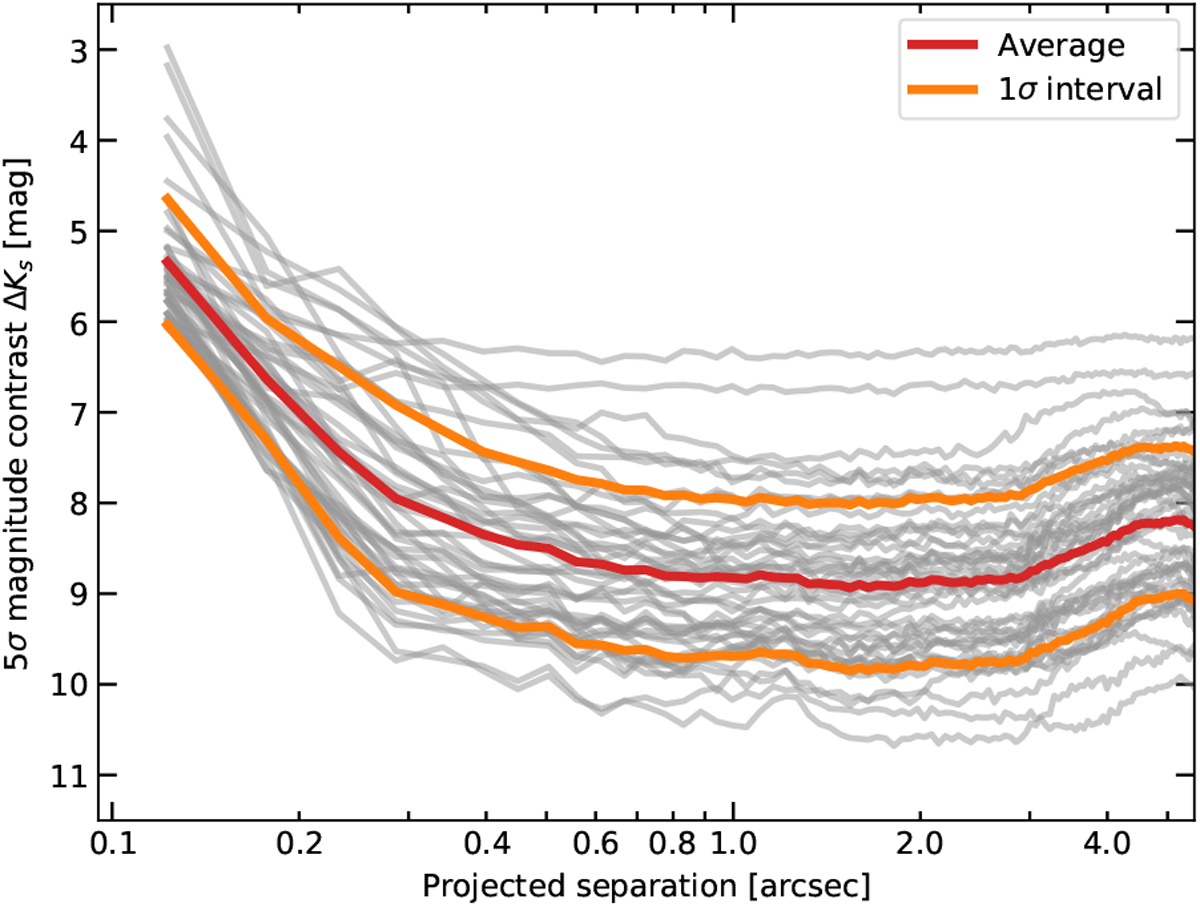
Detection limits of our SPHERE survey for detection of stellar companions to known exoplanet host stars. Thegrey lines represent all individual targets and epochs as presented in Table A.1, and thered curve and orange curves indicate the average contrast performance and the corresponding 1σ interval.
Current usage metrics show cumulative count of Article Views (full-text article views including HTML views, PDF and ePub downloads, according to the available data) and Abstracts Views on Vision4Press platform.
Data correspond to usage on the plateform after 2015. The current usage metrics is available 48-96 hours after online publication and is updated daily on week days.
Initial download of the metrics may take a while.