Fig. 11
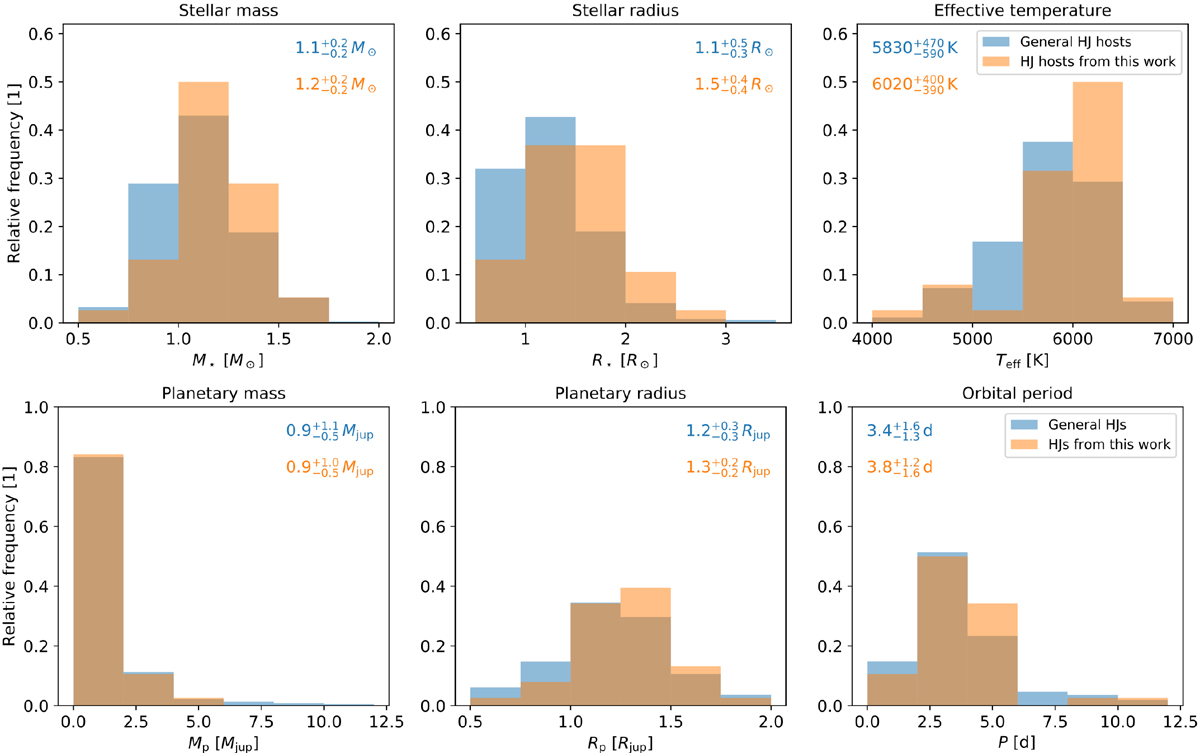
Histograms of hot Jupiter (HJ) system properties. We compare the targets analysed within the scope of this study (orange bars) to a general sample of hot Jupiter environments (blue bars). Top panel: relative frequency distributions of stellar masses M⋆, radii R⋆, and effective temperatures Teff amongst both samples. Lower panel: properties of the transiting companions such as planetary masses Mp, planetary radii Rp, and orbital periods P. In the upper part of each plot, we present the 68% confidence intervals around the medians of the corresponding distributions.
Current usage metrics show cumulative count of Article Views (full-text article views including HTML views, PDF and ePub downloads, according to the available data) and Abstracts Views on Vision4Press platform.
Data correspond to usage on the plateform after 2015. The current usage metrics is available 48-96 hours after online publication and is updated daily on week days.
Initial download of the metrics may take a while.