| Issue |
A&A
Volume 642, October 2020
|
|
|---|---|---|
| Article Number | A86 | |
| Number of page(s) | 23 | |
| Section | Galactic structure, stellar clusters and populations | |
| DOI | https://doi.org/10.1051/0004-6361/201936756 | |
| Published online | 09 October 2020 | |
A wide survey for circumstellar disks in the Lupus complex
1
Scottish Universities Physics Alliance (SUPA), School of Physics and Astronomy, University of St. Andrews, North Haugh, Fife, KY16 9SS St. Andrews, UK
e-mail: psdvt@st-andrews.ac.uk
2
University of Vienna, Department of Astrophysics, Türkenschanzstrasse 17, 1180 Vienna, Austria
Received:
22
September
2019
Accepted:
23
July
2020
Previous star formation studies have, out of necessity, often defined a population of young stars confined to the proximity of a molecular cloud. Gaia allows us to examine a wider, three-dimensional structure of nearby star forming regions, leading to a new understanding of their history. We present a wide-area survey covering 494 deg2 of the Lupus complex, a prototypical low-mass star forming region. Our survey includes all known molecular clouds in this region as well as parts of the Upper Scorpius and Upper Centaurus Lupus (UCL) groups of the Sco-Cen complex. We combine Gaia DR2 proper motions and parallaxes as well as ALLWISE mid-infrared photometry to select young stellar objects (YSOs) with disks. The YSO ages are inferred from Gaia color-magnitude diagrams, and their evolutionary stages from the slope of the spectral energy distributions. We find 98 new disk-bearing sources. Our new sample includes objects with ages ranging from 1 to 15 Myr and masses ranging from 0.05 to 0.5 M⊙, and consists of 56 sources with thick disks and 42 sources with anemic disks. While the youngest members are concentrated in the clouds and at distances of 160 pc, there is a distributed population of slightly older stars that overlap in proper motion, spatial distribution, distance, and age with the Lupus and UCL groups. The spatial and kinematic properties of the new disk-bearing YSOs indicate that Lupus and UCL are not distinct groups. Our new sample comprises some of the nearest disks to Earth at these ages, and thus provides an important target for follow-up studies of disks and accretion in very low mass stars, for example with ALMA and ESO-VLT X-shooter.
Key words: proper motions / parallaxes / stars: formation / circumstellar matter / ISM: clouds / ISM: structure
© ESO 2020
1. Introduction
The highly successful Spitzer mid-infrared observational studies of young stellar clusters have been mostly spatially restricted to regions of dense molecular clouds because it was too expensive and/or not feasible to explore larger areas on the sky (e.g., Evans et al. 2009). As a result, the extended population of young stellar clusters were not fully sampled or surveyed. Data from all-sky surveys are needed to identify and characterize these extended populations. Young stellar objects (YSOs) that populate the extended haloes of star formation regions can be identified with the Wide-field Infrared Survey Explorer cryogenic survey (WISE; Wright et al. 2010), particularly for nearby star forming regions where WISE is sensitive enough to sample the majority of the initial mass function (IMF) mass range. Furthermore, before the advent of the revolutionary Gaia astrometric mission (Gaia Collaboration 2016), even most of the nearby star formation regions had insufficient proper motion information available to establish kinematic membership down to low stellar masses. The combination of these two multiwavelength all-sky surveys, WISE and Gaia, are allowing us to now complete cluster membership, which is essential for obtaining more accurate values of, for example, the IMF, disk fractions, star formation rates, star formation history, and cluster expansion rate. This paper analyzes the extended population of the Lupus complex as a demonstration of the importance of identifying off-cloud stellar members of young stellar clusters. Lupus has become a benchmark for studies of disks and accretion (e.g., Merín et al. 2008; Alcalá et al. 2017) and also for studies of brown dwarf formation (e.g., Muzić et al. 2014). In light of new data availability, it is now necessary to revisit this region with a broader perspective to update its membership list and star formation history.
The Lupus complex is conventionally described as being composed of nine clouds (Hara et al. 1999). The distance to the individual clouds vary between 200 pc and 140 pc (Zucker et al. 2019). The complex spans an area of roughly 22° × 15°, which corresponds to a physical size of approximately 62 × 42 pc, and sits just above the Galactic plane. Figure 1 shows an extinction map of the complex in which the nine clouds are indicated by rectangles. The clouds are different in terms of their star formation activity; the most productive cloud is Lupus 3, which has an optically revealed stellar cluster of young accreting stars (Schwartz 1977; Nakajima et al. 2003; Comerón et al. 2003). Spitzer observations have confirmed the relatively high fraction of YSOs in Lupus 3 compared to the other clouds (Cieza et al. 2007; Merín et al. 2008). Even though Lupus 3 has a more evolved YSO population, it also has dense cores and protostars still forming within those cores (Teixeira et al. 2005; Tachihara et al. 2007). The other Lupus clouds that also have dense protostellar cores are Lupus 1 and Lupus 4 (Benedettini et al. 2011; Rygl et al. 2012). Using Gaia DR 2 data, Manara et al. (2018) found that only 5 of the 83 Spitzer selected YSO candidates in Lupus 5 and Lupus 6 have parallaxes and proper motions consistent with being members of the Lupus 5 cloud. The remaining clouds in the Lupus complex, namely, Lupus 2, Lupus 7, Lupus 8, and Lupus 9, do not appear to have ongoing star formation. It should be noted that the latter clouds have not been observed in the same level of detail as Lupus 1, Lupus 3, and Lupus 4. Furthermore, currently little is known about the off-cloud Lupus population.
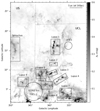 |
Fig. 1. Planck extinction map of the Lupus complex (Planck Collaboration XI 2014), showing the area surveyed in this paper. The eight historically identified Lupus clouds are marked by rectangles. A scale bar of 5 pc (at a distance of 160 pc) is shown for reference. Part of the Ophiuchus cloud is located within the surveyed area, as identified by the dashed rectangle. The dotted lines mark the borders of Upper Scorpius and Upper Centaurus-Lupus subgroups according to de Zeeuw et al. (1999). The circles mark the locations of the compact groups V1062 Sco/UCL-1 and UCL-3 (Röser et al. 2018; Damiani et al. 2019). |
The area surveyed in this paper (Fig. 1) also includes part of the Upper Scorpius (US; age ≈ 4–6 Myr) and the Upper Centaurus-Lupus (UCL; age ≈ 15–22 Myr) subgroups, and the co-moving subgroup V1062 Scorpii (V1062Sco; age < 25 Myr) in the Scorpius-Centaurus OB association (de Zeeuw et al. 1999; Mamajek et al. 2002; Wright & Mamajek 2018; Röser et al. 2018). These populations, particularly those of Lupus and UCL, therefore overlap along the line-of-sight, which is the main limitation when searching for off-cloud Lupus YSO members. Indeed, disentangling different populations along the line-of-sight is an issue that is increasingly important to solve as survey areas get larger. In this particular case, because the distances spanned by Lupus, UCL, US, and V1062 Sco also overlap, these populations may be physically connected (as hinted by Comerón 2008).
A recent analysis of the Sco OB2 association carried out by Damiani et al. (2019) using the second data release of Gaia has identified several populations within the region shown in Fig. 1, namely, the compact groups UCL-1 (corresponding to V1062 Sco), UCL-3, and Lup-III, and the diffuse groups D1 and D2 (further subdivided into sub-populations D2a, D2b, and USC-D2 in Upper Sco). We revisit the region encompassing the Lupus molecular cloud complex to identify the dispersed disk population associated with the Lupus molecular clouds.
We make use of the two aforementioned complementary all-sky photometric surveys to identify disk-bearing YSOs: ALLWISE (Cutri 2013) in the mid-infrared to identify sources with excess emission characteristic of circumstellar disks, and Gaia (Gaia Collaboration 2016) to identify sources that share the same proper motion and distance with the aim to attribute kinematic membership of new disked sources to Lupus, UCL, US, or V1062 Sco. The paper is organized as follows: Sect. 2 describes these two datasets and the flagging performed to remove possible contaminants; Sect. 3 shows the selection criteria used for identifying YSOs; Sect 4 explores their mid-infrared and astrometric properties; Sect. 5 explores the results, and finally we present the conclusions in Sect. 6.
2. Datasets and filtering
The area analyzed in this paper covers the entire Lupus complex, extending from 330°< l< 349°, and 1.6°< b< 27.6°, as shown in Fig. 1, including all the nine Lupus clouds and an extensive area around them. The purpose of using such a large area is to identify both on- and off-cloud sources in a systematic and unbiased manner to test the boundaries of individual star forming regions, to ultimately achieve a complete census of well characterized YSOs, and to constrain the star formation history for low-mass regions.
2.1. Gaia
Gaia (Gaia Collaboration 2016) data release 2 (DR2, Gaia Collaboration 2018; Lindegren et al. 2018) data was obtained through the ESA Gaia TAP service in TOPCAT (Taylor 2005). The Astronomical Data Query Language (ADQL; Ortiz et al. 2008) script is shown in Appendix B. We restricted the query to sources with parallaxes between 4 mas and 12 mas (covering the distance range to the Lupus clouds found by Zucker et al. 2019), and with errors in their proper motions to less than 1 mas. In this work we adopt the Gaia distance estimates calculated by Bailer-Jones et al. (2018).
2.2. ALLWISE
In addition to Gaia data, we use ALLWISE photometry (Cutri 2013) to identify sources with excess infrared emission. AllWISE makes use of data from the Wide-field Infrared Survey Explorer cryogenic survey (WISE, Wright et al. 2010) and NEOWISE post-cryogenic survey (Mainzer et al. 2011); it consists of mid-infrared photometry in four broad bands, W1, W2, W3, and W4, centered at wavelengths 3.6 μm, 4.6 μm, 11.6 μm, and 22.1 μm, respectively. The ESA Gaia archive1 provides cross-matched catalogs between Gaia DR2 and other surveys, including ALLWISE. The ADQL query we used runs an identity cross-match using the Gaia source IDs between the catalogs gaiadr2.gaia_source and gaiadr2.allwise_best_neighbour. Since the Lupus complex extends to very low Galactic latitudes, cross-matching Gaia with ALLWISE can be problematic due to crowding near the Galactic plane (exacerbated by WISE’s relatively large PSF) and lead to missed matches. Wilson & Naylor (2017) have explored this issue in detail and provide an alternative cross-matched catalog for the Galactic plane region, |b| < 10° (Wilson & Naylor 2018). The aforementioned cross-match between gaiadr2.gaia_source and gaiadr2.allwise_best_neighbour for b < 10° yields 8, 210 sources. We queried the TAPVizieR table IV/35/wn18_b10 (Wilson & Naylor 2018) (see Appendix B for the ADQL script) and did a cross-match with the gaiadr2.gaia_source table using the Gaia source IDs and obtained 9, 289 matches. We thus use the latter catalog for b < 10° since it yielded 1, 079 more matches. Finally, we used the NASA/IPAC Infrared Science Archive to obtain the ALLWISE photometry and respective flags, cross-matching on the ALLWISE source IDs. This combined catalog also contains near infrared photometry from 2MASS (Skrutskie et al. 2006).
Due to the large area of the Lupus complex, and its proximity to the Galactic plane, it is necessary to filter out possible contaminants in our catalog. In order to achieve this we set four conditions on the ALLWISE data2. We first set cc_flags = 0000; the contamination and confusion flag is composed of a four-character string, one character per band [W1/W2/W3/W4], that indicates that the photometry and/or position measurements of a source may be contaminated or biased due to proximity to an image artifact. Values of zero indicate that the source is unaffected by known artifacts. We then set ext_flg = 0; the extended source flag is an integer flag that we use to exclude extended sources (e.g., galaxies and cirrus mis-identifications). A value of zero indicates that the source shape is consistent with a point-source and the source is not associated with or superimposed on a 2MASS Extended Source Catalog source. Some YSOs that are embedded and have reflection nebulae may be filtered out using this criterium. Thirdly, we set w1snr, w2snr, w3snr > 5; a signal-to-noise ratio detection greater than 5 for the bands W1, W2, and W3. Lastly, we set w1flg, w2flg, w3flg ≤ 1; the aperture measurement quality flag indicates if one or more image pixels in the measurement aperture for this band is confused with nearby objects, is contaminated by saturated or otherwise unusable pixels, or is an upper limit. A value of zero indicates no contamination, while a value of 1 indicates that another source falls within the measurement aperture. We retain the latter sources in our YSO selection; the new YSOs with these values are appropriately identified in this paper. Removing them from the YSO sample does not change the main conclusions of the paper, so we opted to keep them in as sources worth further investigation in the future.
It should be noted that not all sources with disks in the area surveyed will be included in our YSO survey, either because the ALLWISE data is not sensitive enough to detect them or because the sources are removed by the aforementioned filtering conditions. We are therefore not able to provide a complete sample of disk-bearing sources, however, the sample we do provide is a robust list of bona fide disk-bearing sources, free from contaminants.
2.3. Previously identified members
We compiled a catalog of confirmed and high probability members of the Lupus clouds previously published in the literature, namely from Merín et al. (2008) and Alcalá et al. (2017). The list of members was cross-matched with the Gaia DR2 catalog and used as a reference point for the proper motion selection, as explained in the next section. The US members were obtained from Luhman et al. (2018), and Upper Centaurus-Lupus members from de Zeeuw et al. (1999); both member lists were cross-matched with the Gaia DR2 catalog. The V1062 Sco members were obtained from Röser et al. (2018). Despite the fact that part of the Ophiuchus molecular cloud is included in our survey area (see Fig. 1), we found no Gaia DR2 detected Ophiuchus members (after cross-matching with the membership list from Cánovas et al. 2019).
We found Gaia DR 2 counterparts to 75% of the aforementioned Lupus membership list. Of these matched sources, we found ALLWISE counterparts to 26% of the diskless Lupus members, and to 65% of the Lupus disk-bearing sources. After applying the ALLWISE filtering (see Sect. 2.2) to the sample of Lupus members with Gaia DR 2 and ALLWISE counterparts, we recover 35% of the known Lupus members with disks. The conservative ALLWISE filtering gives us greater confidence that we will select bona-fide disk-bearing sources.
3. Selection of disk-bearing YSOs
3.1. Spectral energy distribution slope.
To identify YSOs with disks, we use the spectral energy distribution (SED) slope between the bands W1 and W3, following the widely used Lada classification scheme (Lada 1987; Lada et al. 2006). The W4 band was not used in this work to identify excess emission because the majority of the photometry in this band corresponds to either upper limits or is severely affected by source confusion. The SED slope is therefore defined as:
where Fλ is the flux density for a given wavelength λ, and λ = [3.6, 4.6, 11.6] μm. The sources were classified into five categories according to αALLWISE, as described in Table 1, and this paper is centered on the analysis of the population of sources with Thick Disks (TDs) and Anemic Disks (ADs).
YSO classification scheme.
3.2. Proper motion.
Having identified disk-bearing YSOs within the region shown in Fig. 1, for distances between 110 pc and 200 pc, we then proceeded to identify those sources that have proper motions consistent with those of previously identified members of Lupus (obtained from Merín et al. 2008; Alcalá et al. 2017). The known Lupus members with Gaia DR 2 counterparts have mean proper motion values of  mas and μδ = −23 ± 2 mas. We use a range of ±5σ as proper motion cuts to select new Lupus YSOs, namely:
  and −33 < μδ < −13 mas.
After applying the proper motion selection across the entire region surveyed, we identified 98 new disk-bearing sources, of which 42 are sources with anemic disks and 56 are sources with thick disks.
Variability. Optical and mid-infrared variability may be an indicator of youth and is very commonly observed in YSOs (e.g., Alencar et al. 2010; Cody et al. 2014). The ALLWISE catalog contains information about variability, derived from the several observing epochs of the NEOWISE campaign for bands W1 and W2. This information is given by the flag “var_flg”, where we take values greater or equal than 6 to denote variability (Hoffman et al. 2012). Of the new disk-bearing YSOs, there is no variability information for 31 sources; for the remaining sources, 8 present variability in bands W1 and W2 (1 TD and 7 ADs). The Gaia DR2 catalog also contains a variability flag, and we find 4 sources classified as variable (1 TD and 3 ADs). However, for the majority of the new YSO sources there is no Gaia variability information available. We identified only one new YSO that presents variability in both Gaia and ALLWISE data.
Figure 2 shows a color-color diagram for the new disked sources. We calculated an empirical disk locus for the Ks − W3 versus (J − H) color-color space by performing a weighted least squares fit to the colors of the disked sources (see Teixeira et al. 2012). The disk locus found is:
![$$ \begin{aligned} (J-H) = (0.05\pm 0.01) \cdot (K_s - [W3]) + (0.60 \pm 0.02). \end{aligned} $$](/articles/aa/full_html/2020/10/aa36756-19/aa36756-19-eq4.gif)
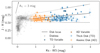 |
Fig. 2. 2MASS-WISE Ks − W3 vs. (J − H) color-color diagram of the new disked sources. The dotted lines denote the position of the disk locus ±5σ. The extinction vector was calculated using the extinction law from Wang & Chen (2019). |
4. Characterization of the new disk-bearing YSOs
4.1. Spatial distribution
Figure 3 shows how the disked population is spatially distributed throughout the region. The more distant YSOs tend to be located in between Lupus 5, Lupus 6, and Lupus 9 and the Galactic Plane; these are likely part of the newly discovered sub-group V1062 Scorpii/UCL-1 (Röser et al. 2018; Damiani et al. 2019). Figure C.1 shows the same distribution for slices of different distance bins. For distances around 16 ± 10 pc, the sources are located near Lupus 1, Lupus 3, and Lupus 4. The nearest YSOs occupy high Galactic Latitudes. This source distribution is consistent with the distances that Zucker et al. (2019) found for the Lupus region, specifically that the clouds closest to the Galactic Plane were more distant. Along with this spatial trend of the YSOs, there is a group of sources that populates the US (and Ophiuchus) region, mostly from 135 pc–160 pc. Figures 3 and C.1 show that the previously known members of Lupus and UCL overlap spatially. The Lupus sources are all located near the molecular clouds, but so are some of the UCL sources.
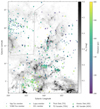 |
Fig. 3. Spatial distribution for the new disk-bearing YSOs (TD, TDV, AD, ADV), and previously known members of Upper Sco, V1062 Sco, UCL, and Lupus, superimposed on the PlanckAV map. The Upper Sco and V1062 Sco YSOs are separated from those of Lupus and/or UCL by the dashed and solid lines, respectively. A more detailed version of this plot is shown in Fig. C.1, where the spatial distribution is shown for different distance slices. |
4.2. Gaia proper motion
As explained in Sect. 3, the new YSOs with disks have proper motions within 5-σ of the proper motions of previously known members of Lupus. The four panels of Fig. 4 show the proper motions of previously known YSO members (pkm) published in the literature for Lupus (Merín et al. 2008; Alcalá et al. 2017), Upper Centaurus-Lupus (de Zeeuw et al. 1999), Upper Scorpius (Luhman et al. 2018), V1062 Sco (Röser et al. 2018), and the new YSOs for each stellar group: the upper left panel shows the proper motions for Lupus, the upper right panel shows the proper motions for UCL; both upper panels show the same new YSO sources. The lower panels shows the proper motions for US (left) and V1062 Sco (right) and their respective new disk-bearing YSOs. The majority of the previously known members are located between 150 pc and 170 pc, yet there are members with distances spanning the entire range, from 115 pc tp 190 pc. Since the sources span a relatively large distance range, the Lupus proper motion plot is reproduced for different distance intervals in Fig. 5; the distance step is larger than the median distance error for the sources. The sources are most concentrated at distances 155 pc to 165 pc, for larger and nearer distances there is more dispersion within the proper motion plots but the new disk-bearing YSOs still follow the Lupus members. Figure 6 shows a panel of proper motion plots for different distance slices for the known UCL members and the same new disk-bearing sources shown in Fig. 5. Figures 5 and 6 show that the new disk-bearing sources have proper motions consistent with both co-moving groups. We show for completeness the same panels of proper motions according to distance for US (Fig. 7) and V1062 Sco (Fig. 8).
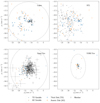 |
Fig. 4. Gaia proper motion diagrams for previously known YSO members and the new disk-bearing YSOs presented in this paper. Upper panels: same new disk-bearing sources, bottom panels: new disk-bearing sources restricted to the respective spatial locations of Upper Sco and V1062 Sco. All panels show an ellipse corresponding to 5 σ of the mean proper motion of the respective confirmed members (the UCL ellipse is larger than the panel). |
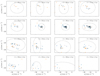 |
Fig. 5. Gaia proper motion diagrams for different distance slices, in steps of 5 pc, Nyquist sampled, for the new disk-bearing YSOs and previously known Lupus members. The symbols are the same as those shown in Fig. 4. Each panel shows the 5 σ proper motion ellipse for the known members at that distance. |
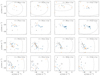 |
Fig. 6. Gaia proper motion diagrams for different distance slices, in steps of 5 pc, Nyquist sampled, for the new disk-bearing YSOs and previously known UCL members. The color symbols are the same as those shown in Fig. 4. Each panel shows the 5 σ proper motion ellipse for the known members at that distance. |
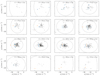 |
Fig. 7. Gaia proper motion diagrams for different distance slices, in steps of 5 pc, Nyquist sampled, for the new and previously known Upper Scorpius YSOs. The symbols are the same as those shown in Fig. 4. Each panel shows the 5 σ proper motion ellipse for the known members at that distance. |
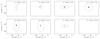 |
Fig. 8. Gaia proper motion diagrams for different distance slices, in steps of 5 pc, Nyquist sampled, for the new and previously known V1062 Sco YSOs. The color symbols are the same as those shown in Fig. 4. Each panel shows the 5 σ proper motion ellipse for the known members at that distance. |
4.3. Gaia color-magnitude diagrams
The new disk-bearing YSOs can be split into probable US and V1062 Sco members according to their spatial distribution (as delimited in Fig. 3). We separate these sources out to better analyze the new disked sources that overlap in proper motion and spatial distribution with the Lupus and UCL members. The three YSO groups were placed on Gaia color-magnitude diagrams (CMD), for the same distance slices as used for Figs. 5 and 6. The Lupus/UCL CMDs are displayed in Fig. 9, the US CMDs are shown in Fig. D.1, and the V1062 Sco CMDs are shown in Fig. E.1. The majority of the new YSOs with disks are very low mass stars, M⋆< 0.5 M⊙, and they fall within an age range of 4 Myr–12 Myr. The youngest sources are located at 155 pc–160 pc and correspond to sources located near Lupus 1, Lupus 3, and Lupus 4. The diskless variable sources are comparatively more massive than the disk-bearing new YSOs, but span the same age range. Sources older than 12 Myr tend to be sources with anemic disks, and are mostly located at distances greater than 175 pc.
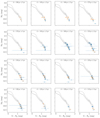 |
Fig. 9. Absolute magnitude vs. color for the new disk-bearing YSOs shown in Figs. 5 and 6. The YSO symbols are the same as those shown in Fig. 4. The extinction-free isochrones correspond to 4 Myr (dashed line, dark gray) and 12 Myr (solid line, dark gray) (Marigo et al. 2017), with mass tracks of 0.1 M⊙, 0.4 M⊙, and 0.7 M⊙ for reference. |
4.4. YSO evolutionary stage and mass distribution
The majority of the new disk-bearing YSOs are part of Lupus or UCL, and are sources with thick disks. Table 2 breaks down the number of YSOs found per stellar group, divided into TDs and ADs following Table 1; it also lists sources that are variable (TDVs and ADVs).
Summary of the number of new disk-bearing YSOs in the various stellar groups, in the area surveyed in this work.
We used the mass tracks in the Gaia CMDs (Figs 9, D.1, and E.1) to derive stellar masses for the new disked YSOs. The sources were further divided into three groups according to their isochronal age: (i) age < 4 Myr, (ii) 12 Myr > age > 4 Myr, and (iii) age > 12 Myr. Figure 10 shows the mass distribution for the disk-bearing YSOs, for each of these age groups. The plot indicates that disk lifetimes are longer for lower mass sources – the oldest disked sources are the least massive ones. This result is consistent with previous observational findings showing there is a disk evolution dependence with stellar mass and that disks evolve later/slower around lower mass stars (e.g., Lada et al. 2006; Teixeira et al. 2012; Ribas et al. 2015). The stellar masses probed here are much lower than previous studies as some of the YSOs are potential brown dwarfs, which has interesting implications for planet formation timescales around substellar objects.
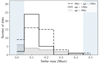 |
Fig. 10. Stellar mass distribution of the new disk-bearing YSOs in Lupus, for different age ranges. The first and last bins (shaded and hatched) are lower limits. |
4.5. Distance and age distribution
Figure 11 shows the distance Probability Density Functions (PDFs) of the new disk-bearing YSOs for three isochronal age groups aforementioned, compared to those of previously known members. They were built using a gaussian kernel distribution estimation with a bandwidth of 0.5. Panels a though f show PDFs (in red) of the majority of the new disk-bearing YSOs, except for those located in the US and V1062 Sco regions. These PDFs are compared to the PDFs (in black) of the previously known members of Lupus in panels a through c, and to those of UCL in panels d through f. We performed nonparametric statistical hypothesis tests to determine if the paired PDFs were drawn from the same population (null hypothesis); specifically, the k-sample Anderson-Darling test, the Kolmogorov–Smirnov test, and the Wilcoxon-Mann-Whitney U test. The corresponding p-values are summarized in Table F.1.
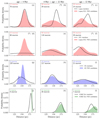 |
Fig. 11. Distance probability density function (PDF) of the new disk-bearing YSOs (color) and the previously known members (black) for Lupus, UCL, US, and V1062 Sco. Each panel indicates the number of sources for the respective PDF. Panels with (*) indicate that the null-hypothesis was rejected in at least one of the non-parametric statistic tests performed. |
The group of YSOs with isochronal age less than 4 Myr is very likely part of Lupus. This is ascertained by comparing panels a and d, and because the statistical tests rejects the null hypothesis for panel d. The group of YSOs with isochronal age greater than 4 Myr and less than 12 Myr is more likely to be part of UCL, since the null hypothesis is rejected for panel b. The oldest group of YSOs, with isochronal age greater than 12 Myr, do not appear to belong to Lupus nor to UCL because the null hypothesis is rejected for the PDFs in panels c and f. This could possibly be explained if the group of either PDF being compared has contaminants, (i.e., is a mixture of populations). When comparing the average proper motions for the new disk-bearing YSOs with those of Lupus and UCL, for the same isochronal age greater than 12 Myr, the YSOs are moving more similarly to UCL (see Table 3).
Mean proper motions, according to age, for the new disk-bearing YSOs and members of Lupus and UCL.
The bottom row of Fig. 11 shows the V1062 Sco new disk-bearing YSOs compared to known members of this comoving group. The row corresponding to panels g through i shows the comparison of the new disk-bearing YSOs in US and its confirmed members. The new V1062 Sco and US YSOs have distance PDFs consistent with those of previously known members.
4.6. Gaia DR2 RUWE as an indicator of possible binarity
The re-normalized unit weight error, RUWE, is an optimized parameter that is used to assess the goodness of the astrometric solution of Gaia DR2 data for single sources (Lindegren et al. 2018). Unresolved binary systems, on the other hand, can cause the astrometric model to perform poorly due to the wobble of the Gaia photocenter. Marginally resolved sources and variable sources may also present excess RUWE (Belokurov et al. 2020). Figure 12 shows the parallax over the error, π/σπ, versus RUWE of the new YSO sources identified in this work, namely in Lupus/UCL, Upper Sco, and V1062 Sco. The great majority of the sources have values of RUWE less than 1.4, indicating a robust astrometric solution. For comparison, we also plot sources with resolved disks from the DSHARP project (Andrews et al. 2018) and spectroscopically confirmed binaries in Upper Sco from Tokovinin & Briceño (2020, binary separations < 0.7″). As can be seen, sources with disks may have larger values of RUWE, and YSO binaries can indeed have much larger values of RUWE. In order to not remove interesting sources from our new YSO samples we have therefore opted to retain sources with values of RUWE larger than the canonical value of 1.4.
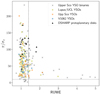 |
Fig. 12. Parallax over error (π/σπ) ve. RUWE of the three new groups of YSOs identified in this work, compared to sources with resolved protoplanetary disks (DSHARP, Andrews et al. 2018) and known binaries in Upper Sco (Tokovinin & Briceño 2020). |
5. On the origin of the new YSOs with disks
The previous section has shown that the new disk-bearing YSOs that are candidate members of the US and V1062 Sco comoving groups are relatively well characterized with respect to proper motion, on-sky spatial distribution, distance distribution, and age. Tables D.1 and E.1 list the source designations and disk type for US and V1062 Sco, respectively.
The remaining YSOs in our sample (Table A.1) are likely composed of sources from both Lupus and UCL, as they present properties that are common to both of these populations; the emerging picture is that the youngest of these YSOs are likely Lupus members, while the older sources are likely part of UCL. Comparison of our new disk-bearing sources in Table A.1 with the YSOs identified by Damiani et al. (2019) yielded 37 out of 60 matches: 45% of the sources were found to belong to the UCL diffuse group D1, and 35% to the UCL diffuse group D2 (further divided into 27% from the D2a sub-group and 8% from the D2b sub-group). Of our new disks in US, 12/19 were identified as belonging to either the diffuse population in Upper Sco USC-D2 (32%), to UCL-D1 (32%), or to UCL-D2a (5%). Regarding the new disks in V1062 Sco, 14/19 were also previously identified by Damiani et al. (2019) as candidate members of the V1062 Sco/UCL-1 compact group.
We discuss in this section the region morphology and kinematics to explore the origin and connection between Lupus, UCL, US, and V1062 Sco.
5.1. Evolution of the 3D spatial distribution
We attempt to reconstruct the 3D distribution of the new disk-bearing YSOs and the Lupus clouds to better determine how the Lupus and UCL stellar groups are related. Figure 13 shows in the upper (middle) row the Galactic Latitude (Longitude) as a function of distance for these sources. Each row has three panels, corresponding to the three iscohronal age groups. These panels also include a schematic representation of the Lupus clouds (the central Galactic coordinates were taken from Hara et al. (1999) and the width of the filled ellipses are merely representative and not to be taken to scale). The distances to Lupus 1, Lupus 2, Lupus 3, and Lupus 4 were derived from the distances to their previously known members (Dzib et al. 2018), and for clouds with no known associated YSOs we use the distances calculated by Zucker et al. (2019) (we exclude the clouds Lupus 7 and Lupus 8, due to the lack of distance estimates). To constrain the origin of a YSO, we explore its travel radius, specifically, the projected distance traversed by a source since its birth assuming a 1D velocity of 1 km s−1. We represent the area corresponding to the travel radius as dotted-line ellipses, assuming the birth-sites are at the center of the clouds: The leftmost column shows ellipses corresponding to the travel radii of 4 Myr for each cloud, while the middle column to that of 12 Myr. Star-formation occurs in dense filaments that thread the cloud, and so the ellipses show the least amount a source would travel and are merely indicative. In addition to that, we do not have strong constraints on the depth of the clouds as mentioned above. The bottom row shows the distribution of these sources on the plane-of-the-sky, overplotted on a Planck extinction map; the shaded red areas mark the 4 Myr and 12 Myr travel radii for the left and middle panels, respectively.
 |
Fig. 13. Top and middle panels: spatial distribution along the line-of-sight of the new disk-bearing YSOs and previously known members (pkm) in Lupus or UCL, for three age groups (less than 4 Myr, between 4 Myr and 12 Myr, and greater than 12 Myr). Seven Lupus clouds are represented schematically by the filled colored ellipses. The 4 Myr travel radii is represented by dotted ellipses, centered on each cloud and is shown in the left columns; the middle columns show the same but for 12 Myr travel radii. Bottom panels: spatial distribution of new Lupus or UCL YSOs, and previous known members, superimposed on the PlanckAv map (the colorscale is the same as that shown in Fig. 1). The shaded red circles represent the 4 Myr and 12 Myr travel radii, for the left and middle panels, respectively. |
The panels from the left column shows that the new disk-bearing YSOs, with isochronal ages less 4 Myr, are mostly confined to the clouds Lupus 1, Lupus 3, and Lupus 4. Apart from three sources that appear to be located nearer or farther, these YSOs are all within the travel radii from the aforementioned clouds and so clearly associated with the Lupus molecular cloud complex (as already indicated by panels a and d of Fig. 11). The three exceptions all have proper motions well within the 5-σ of the average proper motions of previously known Lupus members.
The panels from the middle column show the distribution of sources with isochronal ages between 4 Myr and 12 Myr. The area traversed by a 12 Myr travel radius is again represented by dotted-line ellipses. The new YSO sources are much more dispersed comparatively to the panels in the left column. Sources within the ellipses could still have formed within the Lupus clouds; Lupus 3 has a distinct group of sources centered on the cloud, while the other clouds in the complex have a few sources that appear associated with them. There is a larger group of sources that are located outside the dotted-line ellipses and the shaded area on the bottom panel, and as such are unlikely to have formed within the Lupus cloud. These sources show a distribution similar to the previously known UCL members and are likely UCL members themselves. The new disk-bearing YSOs ages between 4 Myr and 12 Myr are thus a mixture of probable members from Lupus and UCL.
The panels from the right column show sources with isochronal ages greater than 12 Myr. The Lupus clouds do not appear to have any clustering of new disk-bearing YSOs, although Lupus 3 has a clustering of previously known members. This may place an age constraint on the Lupus 3 cloud: its lifetime is at least 12 Myr long. The new disk-bearing YSOs in this age bracket show the same distribution as UCL members. As can be seen, the spatially dispersed disk population is older than the disks associated with the molecular clouds, in agreement with the results from Damiani et al. (2019).
Regarding the ages of the clouds, Lupus 1 is the youngest star forming cloud (Krause et al. 2018), followed by the Lupus 3 and Lupus 4 clouds. Lupus 3 in particular appears to have formed sources over a wider period of time compared to the other clouds (in agreement with Damiani et al. 2019, who also find that there is a large spread in apparent ages of the youngest compact groups). The Lupus 5 and Lupus 6 clouds appear to be older which is consistent with the recent findings of Melton (2020). We do not have enough information to constrain the relative ages of the remaining clouds in the complex. Within the Lupus complex, star formation would thus seem to be progressing from the more distant and lower clouds, to the closer and higher latitude clouds.
5.2. Kinematics of Lupus complex
We analyzed the kinematics of the US, Lupus, and UCL groups as a function of distance. Figure 14 shows four panels with the median values for each distance slice of the proper motions along RA and Dec,  and μδ; the total proper motion,
  , and the transverse velocity, VT which is given by:
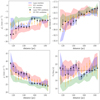 |
Fig. 14. Overall proper motion and transverse velocity as a function of distance for the previously known members and new disk-bearing YSOs of the Lupus, UCL, and US groups. The data points denote the median values for each distance slice and the error bars corresponds to the respective median absolute deviation; the black data points correspond to values for the new disk-bearing YSOs in Lupus or UCL, while the orange data points correspond to values for the new disk-bearing YSOs in US. Each panel shows the corresponding median absolute deviation for known members for Lupus, US, and UCL (shaded bands). The dotted line in the bottom right panel corresponds to a linear fit to the transverse velocity over distance for the new YSO Lupus/UCL members: VT = 20 ± 1 km s−1. |
The three groups of previously known members are represented by a curve or band where the width is the median absolute deviation; previously known Lupus members correspond to the blue shaded band, UCL by a red band, and US by a green band. The new disk-bearing YSOs in US and Lupus/UCL are also shown as data points with error bars in orange and black, respectively. The new US YSOs show the same functional variation with distance as the previously know US members, albeit with higher velocities. These plots also show that the new disk-bearing candidate members of Lupus/UCL follow the kinematics of the previously known Lupus members, however, they are also consistent with the motion of UCL members, particularly for distances smaller than 150 pc. Their transverse velocity can be described as being constant3, with VT = 20 ± 1 km s−1, meaning the new disk-bearing sources that are candidate members of Lupus/UCL are moving at the same speed irrespective of their distance. There is some sub-structure in the velocity around 155 pc, which is the distance where the youngest sources are located, but otherwise the transverse velocity of the new disk-bearing cannot be differentiated from those of Lupus or UCL. The emerging picture is that Lupus sources are part of UCL – the previously known Lupus sources and the new disk-bearing YSOs with ages less than 4 Myr are the tail end of star formation in UCL, in much the same way that ρ Ophiuchus is the tail end of star formation of US.
6. Conclusion
The main results of our survey are:
-
Using Gaia DR2 and ALLWISE data, we identify 98 new low-mass YSOs within the wider Lupus complex. These sources were identified via their SED slope in the mid-infrared, and variability in the mid-infrared and optical. The evolutionary state of the new disk-bearing YSOs are as follows: 56 are sources with thick disks and 42 are sources with anemic disks.
-
We use the Upper Scorpius (l,b) boundary to identify potential new US members, likewise for the V 1062 Scorpii sub-group. The proper motion of these new members fall within 5σ of the proper motion of previously confirmed members. The new disk-bearing YSOs are thus distributed: 19 new disks in the Upper Scorpius region, 19 new disks in region of the V 1062 Scorpius sub-group, and 60 new disks in the region that is occupied by both Lupus and UCL.
-
The new disk-bearing YSOs are low mass sources, most with masses less than 0.4 M⊙. Dividing the YSOs in three age groups shows that the stellar mass of disk bearing sources decreases with age.
-
A combined analysis of the distance, age, and kinematic distribution of the new disk-bearing YSOs that fall within the Lupus/UCL region indicate that Lupus and UCL are not distinct groups because many of their properties are indistinguishable. On the contrary, the emerging picture is that the latest star formation episode taking place in the Lupus clouds (particularly Lupus 1, Lupus 3, and Lupus 4) is the tail end of star formation of UCL.
See http://wise2.ipac.caltech.edu/docs/release/allwise/expsup/sec2_1a.html#cc_flags for a complete description of the column descriptions in the ALLWISE source catalog.
A linear regression fit to the data points corresponding to the new Lupus/UCL disk-bearing sources (bottom right panel of Fig. 14) yields VT(km s−1) = (20 ± 1)+(0.000 ± 0.001) ⋅ Distance(pc).
Acknowledgments
We would like to thank the anonymous referee for their valuable comments that helped improve the manuscript. This project was supported by STFC grant ST/R000824/1. This work has made use of data from the European Space Agency (ESA) mission Gaia (https://www.cosmos.esa.int/gaia), processed by the Gaia Data Processing and Analysis Consortium (DPAC, https://www.cosmos.esa.int/web/gaia/dpac/consortium). Funding for the DPAC has been provided by national institutions, in particular the institutions participating in the Gaia Multilateral Agreement. This publication makes use of data products from the Wide-field Infrared Survey Explorer, which is a joint project of the University of California, Los Angeles, and the Jet Propulsion Laboratory/California Institute of Technology, and NEOWISE, which is a project of the Jet Propulsion Laboratory/California Institute of Technology. WISE and NEOWISE are funded by the National Aeronautics and Space Administration. This research has made use of the VizieR catalog access tool, CDS, Strasbourg, France. This research has made use of the NASA/ IPAC Infrared Science Archive, which is operated by the Jet Propulsion Laboratory, California Institute of Technology, under contract with the National Aeronautics and Space Administration. This research has made use of Python, https://www.python.org, NumPy (van der Walt et al. 2011), and Matplotlib (Hunter 2007). This research made use of APLpy, an open-source plotting package for Python and hosted at http://aplpy.github.com (Robitaille & Bressert 2012). This research made use of Astropy, a community-developed core Python package for Astronomy (Astropy Collaboration 2013). This research made use of TOPCAT, an interactive graphical viewer and editor for tabular data (Taylor 2005).
References
- Alcalá, J. M., Manara, C. F., Natta, A., et al. 2017, A&A, 600, A20 [NASA ADS] [CrossRef] [EDP Sciences] [Google Scholar]
- Alencar, S. H. P., Teixeira, P. S., Guimarães, M. M., et al. 2010, A&A, 519, A88 [NASA ADS] [CrossRef] [EDP Sciences] [Google Scholar]
- Andrews, S. M., Huang, J., Pérez, L. M., et al. 2018, ApJ, 869, L41 [NASA ADS] [CrossRef] [Google Scholar]
- Astropy Collaboration (Robitaille, T. P., et al.) 2013, A&A, 558, A33 [NASA ADS] [CrossRef] [EDP Sciences] [Google Scholar]
- Bailer-Jones, C. A. L., Rybizki, J., Fouesneau, M., Mantelet, G., & Andrae, R. 2018, ApJ, 156, 58 [Google Scholar]
- Belokurov, V., Penoyre, Z., Oh, S., et al. 2020, MNRAS [Google Scholar]
- Benedettini, M., Pezzuto, S., Burton, M. G., et al. 2011, MNRAS, 419, 238 [NASA ADS] [CrossRef] [Google Scholar]
- Cánovas, H., Cantero, C., Cieza, L., et al. 2019, A&A, 626, A80 [NASA ADS] [CrossRef] [EDP Sciences] [Google Scholar]
- Cieza, L., Padgett, D. L., Stapelfeldt, K. R., et al. 2007, ApJ, 667, 308 [NASA ADS] [CrossRef] [Google Scholar]
- Cody, A. M., Stauffer, J., Baglin, A., et al. 2014, ApJ, 147, 82 [Google Scholar]
- Comerón, F. 2008, Handbook of Star Forming Regions, I, 295 [Google Scholar]
- Comerón, F., Fernández, M., Baraffe, I., Neuhäuser, R., & Kaas, A. A. 2003, A&A, 406, 1001 [NASA ADS] [CrossRef] [EDP Sciences] [Google Scholar]
- Cutri, R. M. 2013, VizieR Online Data Catalog: II/328 [Google Scholar]
- Damiani, F., Prisinzano, L., Pillitteri, I., Micela, G., & Sciortino, S. 2019, A&A, 623, A112 [NASA ADS] [CrossRef] [EDP Sciences] [Google Scholar]
- de Zeeuw, P. T., Hoogerwerf, R., de Bruijne, J. H. J., Brown, A. G. A., & Blaauw, A. 1999, AJ, 117, 354 [NASA ADS] [CrossRef] [Google Scholar]
- Dzib, S. A., Loinard, L., Ortiz-León, G. N., Rodríguez, L. F., & Galli, P. A. B. 2018, ApJ, 867, 151 [NASA ADS] [CrossRef] [Google Scholar]
- Evans, N. J., Dunham, M. M., Jørgensen, J. K., et al. 2009, ApJS, 181, 321 [NASA ADS] [CrossRef] [Google Scholar]
- Gaia Collaboration (Prusti, T., et al.) 2016, A&A, 595, A1 [NASA ADS] [CrossRef] [EDP Sciences] [Google Scholar]
- Gaia Collaboration (Brown, A. G. A., et al.) 2018, A&A, 616, A1 [NASA ADS] [CrossRef] [EDP Sciences] [Google Scholar]
- Hara, A., Tachihara, K., Mizuno, A., et al. 1999, PASJ, 51, 895 [NASA ADS] [Google Scholar]
- Hoffman, D. I., Cutri, R. M., Masci, F. J., et al. 2012, ApJ, 143, 118 [CrossRef] [Google Scholar]
- Hunter, J. D. 2007, Comput. Sci. Eng., 9, 90 [NASA ADS] [CrossRef] [Google Scholar]
- Krause, M. G. H., Burkert, A., Diehl, R., et al. 2018, A&A, 619, A120 [NASA ADS] [CrossRef] [EDP Sciences] [Google Scholar]
- Kuruwita, R. L., Ireland, M., Rizzuto, A., Bento, J., & Federrath, C. 2018, MNRAS [Google Scholar]
- Lada, C. J. 1987, IN: Star forming regions; Proceedings of the Symposium (Tucson, AZ: Sreward Observatory), 1 [Google Scholar]
- Lada, C. J., Muench, A. A., Luhman, K. L., et al. 2006, AJ, 131, 1574 [Google Scholar]
- Lindegren, L., Hernández, J., Bombrun, A., et al. 2018, A&A, 616, A2 [NASA ADS] [CrossRef] [EDP Sciences] [Google Scholar]
- Luhman, K. L., Herrmann, K. A., Mamajek, E. E., Esplin, T. L., & Pecaut, M. J. 2018, ApJ, 156, 76 [Google Scholar]
- Mainzer, A., Bauer, J., Grav, T., et al. 2011, ApJ, 731, 53 [NASA ADS] [CrossRef] [Google Scholar]
- Mamajek, E. E., Meyer, M. R., & Liebert, J. 2002, AJ, 124, 1670 [NASA ADS] [CrossRef] [Google Scholar]
- Manara, C. F., Prusti, T., Comerón, F., et al. 2018, A&A [Google Scholar]
- Marigo, P., Girardi, L., Bressan, A., et al. 2017, ApJ, 835, 77 [NASA ADS] [CrossRef] [Google Scholar]
- Melton, E. 2020, ApJ, 159, 220 [Google Scholar]
- Merín, B., Jørgensen, J., Spezzi, L., et al. 2008, ApJS, 177, 551 [Google Scholar]
- Muzić, K., Scholz, A., Geers, V. C., Jayawardhana, R., & López Martí, B. 2014, ApJ, 785, 159 [NASA ADS] [CrossRef] [Google Scholar]
- Nakajima, Y., Nagata, T., Sato, S., et al. 2003, AJ, 125, 1407 [NASA ADS] [CrossRef] [Google Scholar]
- Ortiz, I., Lusted, J., Dowler, P., et al. 2008, IVOA Recommendation 30 October 2008 [Google Scholar]
- Planck Collaboration XI. 2014, A&A, 571, A11 [NASA ADS] [CrossRef] [EDP Sciences] [Google Scholar]
- Ribas, Á., Bouy, H., & Merín, B. 2015, A&A, 576, A52 [NASA ADS] [CrossRef] [EDP Sciences] [Google Scholar]
- Robitaille, T., & Bressert, E. 2012, Astrophysics Source Code Library [record ascl:1208.017] [Google Scholar]
- Röser, S., Schilbach, E., Goldman, B., et al. 2018, A&A, 614, A81 [NASA ADS] [CrossRef] [EDP Sciences] [Google Scholar]
- Rygl, K. L. J., Benedettini, M., Schisano, E., et al. 2012, A&A, 549, L1 [Google Scholar]
- Schwartz, R. D. 1977, ApJ, 35, 161 [NASA ADS] [CrossRef] [Google Scholar]
- Skrutskie, M. F., Cutri, R. M., Stiening, R., et al. 2006, AJ, 131, 1163 [NASA ADS] [CrossRef] [Google Scholar]
- Tachihara, K., Rengel, M., Nakajima, Y., et al. 2007, ApJ, 659, 1382 [NASA ADS] [CrossRef] [Google Scholar]
- Taylor, M. B. 2005, Astronomical Data Analysis Software and Systems XIV, ASP Conf. Ser., 347, 29 [Google Scholar]
- Teixeira, P. S., Lada, C. J., & Alves, J. F. 2005, ApJ, 629, 279 [NASA ADS] [CrossRef] [Google Scholar]
- Teixeira, P. S., Lada, C. J., Marengo, M., & Lada, E. A. 2012, A&A, 540, A83 [NASA ADS] [CrossRef] [EDP Sciences] [Google Scholar]
- Tokovinin, A., & Briceño, C. 2020, ApJ, 159, 15 [Google Scholar]
- van der Walt, S., Colbert, S. C., & Varoquaux, G. 2011, Comput. Eng. Sci., 13, 22 [Google Scholar]
- Wang, S., & Chen, X. 2019, ApJ, 877, 116 [NASA ADS] [CrossRef] [Google Scholar]
- Wilson, T. J., & Naylor, T. 2017, MNRAS, 468, 2517 [CrossRef] [Google Scholar]
- Wilson, T. J., & Naylor, T. 2018, MNRAS, 481, 2148 [NASA ADS] [CrossRef] [Google Scholar]
- Wright, E. L., Eisenhardt, P. R. M., Mainzer, A. K., et al. 2010, ApJ, 140, 1868 [Google Scholar]
- Wright, N. J., & Mamajek, E. E. 2018, MNRAS, 476, 381 [NASA ADS] [CrossRef] [Google Scholar]
- Zucker, C., Speagle, J. S., Schlafly, E. F., et al. 2019, ApJ, 876, 125 [NASA ADS] [CrossRef] [Google Scholar]
Appendix A: Additional table
New disk-bearing YSO candidate members of Lupus and/or UCL.
Appendix B: Gaia and ALLWISE ADQL queries
ADQL-2.0 script used to select sources from the ESA Gaia table gaiadr2.gaia_source:
SELECT *
FROM gaiadr2.gaia_source
WHERE l BETWEEN 330 AND 349
        AND
        b BETWEEN 1.6 AND 27.6
        AND
        parallax BETWEEN 4 AND 12
        AND
        gaia.pmra_error < 1 AND pmdec_error < 1
ADQL-2.0 script used to cross-match the ESA Gaia tables gaiadr2.gaia_source and gaiadr2.allwise_best_neighbour:
SELECT *
FROM gaiadr2.gaia_source as gaia
INNER JOIN gaiadr2.allwise_best_neighbour as allwise
ON gaia.source_id=allwise.source_id
WHERE gaia.l BETWEEN 330 AND 349
        AND
        gaia.b BETWEEN 1.6 AND 27.6
        AND
        gaia.parallax BETWEEN 4 AND 12
        AND
        gaia.pmra_error < 1 AND gaia.pmdec_error <1
ADQL-2.0 script to query the TAPVizieR table IV/35/wn18_b10 from Wilson & Naylor (2018) at http://tapvizier.u-strasbg.fr/adql/?IV/35:
SELECT
"IV/35/wn18_b10".RAICRS, "IV/35/wn18_b10".DEICRS,
"IV/35/wn18_b10".GAIA, "IV/35/wn18_b10".WISE,
"IV/35/wn18_b10".RAWdeg, "IV/35/wn18_b10".DEWdeg,
"IV/35/wn18_b10".gmag, "IV/35/wn18_b10".W1mag,
"IV/35/wn18_b10".W2mag, "IV/35/wn18_b10".W3mag,
"IV/35/wn18_b10".W4mag, "IV/35/wn18_b10".MatchP,
"IV/35/wn18_b10".eta, "IV/35/wn18_b10".xi,
"IV/35/wn18_b10".ContP1,"IV/35/wn18_b10".ContP10,
"IV/35/wn18_b10".avgCont
FROM "IV/35/wn18_b10"
WHERE
1=CONTAINS(POINT('ICRS',"IV/35/wn18_b10".RAICRS,
        "IV/35/wn18_b10".DEICRS), CIRCLE('GALACTIC',
        340.25, +15.25, 18.))
Appendix C: Spatial distribution of the YSOs
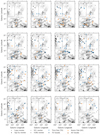 |
Fig. C.1. Spatial distribution for the YSOs, and previously known members, for different distance slices, superimposed on the PlanckAV map (colorscale is the same as in Fig. 1). The Upper Sco and V1062 Sco regions are marked by dashed and solid lines, respectively. |
Appendix D: Upper scorpius
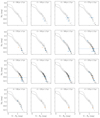 |
Fig. D.1. Absolute magnitude vs. color for the previously known Upper Sco members (gray circles) and the new candidate members presented in this paper. The YSO symbols are the same as those shown in Fig. 4. The extinction-free isochrones correspond to 4 Myr (dashed line, dark gray) and 12 Myr (solid line, dark gray) (Marigo et al. 2017), with mass tracks of 0.1 M⊙, 0.4 M⊙, and 0.7 M⊙ for reference. |
New disk-bearing YSO US candidate members.
Appendix E: V1062 Scorpii
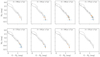 |
Fig. E.1. Absolute magnitude vs. color for the previously known V1062 Sco members (gray circles) and the new candidate members presented in this paper. The YSO symbols are the same as those shown in Fig. 4. The extinction-free isochrones correspond to 4 Myr (dashed line, dark gray) and 12 Myr (solid line, dark gray) (Marigo et al. 2017), with mass tracks of 0.1 M⊙, 0.4 M⊙, and 0.7 M⊙ for reference. |
Candidate new V1062 Sco disk-bearing YSOs.
Appendix F: Non-parametric hypothesis testing of distance PDFs
The Anderson-Darling test is more sensitive to the tails of the distributions being compared, while the K-S test is more sensitive to the centers of the distributions. One should also use caution in the interpretation of the results due to the small number of sources in some distributions (< 20).
Summary of p-values for the different paired distance probability density functions (PDFs).
All Tables
Summary of the number of new disk-bearing YSOs in the various stellar groups, in the area surveyed in this work.
Mean proper motions, according to age, for the new disk-bearing YSOs and members of Lupus and UCL.
Summary of p-values for the different paired distance probability density functions (PDFs).
All Figures
|
Fig. 1. Planck extinction map of the Lupus complex (Planck Collaboration XI 2014), showing the area surveyed in this paper. The eight historically identified Lupus clouds are marked by rectangles. A scale bar of 5 pc (at a distance of 160 pc) is shown for reference. Part of the Ophiuchus cloud is located within the surveyed area, as identified by the dashed rectangle. The dotted lines mark the borders of Upper Scorpius and Upper Centaurus-Lupus subgroups according to de Zeeuw et al. (1999). The circles mark the locations of the compact groups V1062 Sco/UCL-1 and UCL-3 (Röser et al. 2018; Damiani et al. 2019). |
| In the text | |
|
Fig. 2. 2MASS-WISE Ks − W3 vs. (J − H) color-color diagram of the new disked sources. The dotted lines denote the position of the disk locus ±5σ. The extinction vector was calculated using the extinction law from Wang & Chen (2019). |
| In the text | |
|
Fig. 3. Spatial distribution for the new disk-bearing YSOs (TD, TDV, AD, ADV), and previously known members of Upper Sco, V1062 Sco, UCL, and Lupus, superimposed on the PlanckAV map. The Upper Sco and V1062 Sco YSOs are separated from those of Lupus and/or UCL by the dashed and solid lines, respectively. A more detailed version of this plot is shown in Fig. C.1, where the spatial distribution is shown for different distance slices. |
| In the text | |
|
Fig. 4. Gaia proper motion diagrams for previously known YSO members and the new disk-bearing YSOs presented in this paper. Upper panels: same new disk-bearing sources, bottom panels: new disk-bearing sources restricted to the respective spatial locations of Upper Sco and V1062 Sco. All panels show an ellipse corresponding to 5 σ of the mean proper motion of the respective confirmed members (the UCL ellipse is larger than the panel). |
| In the text | |
|
Fig. 5. Gaia proper motion diagrams for different distance slices, in steps of 5 pc, Nyquist sampled, for the new disk-bearing YSOs and previously known Lupus members. The symbols are the same as those shown in Fig. 4. Each panel shows the 5 σ proper motion ellipse for the known members at that distance. |
| In the text | |
|
Fig. 6. Gaia proper motion diagrams for different distance slices, in steps of 5 pc, Nyquist sampled, for the new disk-bearing YSOs and previously known UCL members. The color symbols are the same as those shown in Fig. 4. Each panel shows the 5 σ proper motion ellipse for the known members at that distance. |
| In the text | |
|
Fig. 7. Gaia proper motion diagrams for different distance slices, in steps of 5 pc, Nyquist sampled, for the new and previously known Upper Scorpius YSOs. The symbols are the same as those shown in Fig. 4. Each panel shows the 5 σ proper motion ellipse for the known members at that distance. |
| In the text | |
|
Fig. 8. Gaia proper motion diagrams for different distance slices, in steps of 5 pc, Nyquist sampled, for the new and previously known V1062 Sco YSOs. The color symbols are the same as those shown in Fig. 4. Each panel shows the 5 σ proper motion ellipse for the known members at that distance. |
| In the text | |
|
Fig. 9. Absolute magnitude vs. color for the new disk-bearing YSOs shown in Figs. 5 and 6. The YSO symbols are the same as those shown in Fig. 4. The extinction-free isochrones correspond to 4 Myr (dashed line, dark gray) and 12 Myr (solid line, dark gray) (Marigo et al. 2017), with mass tracks of 0.1 M⊙, 0.4 M⊙, and 0.7 M⊙ for reference. |
| In the text | |
|
Fig. 10. Stellar mass distribution of the new disk-bearing YSOs in Lupus, for different age ranges. The first and last bins (shaded and hatched) are lower limits. |
| In the text | |
|
Fig. 11. Distance probability density function (PDF) of the new disk-bearing YSOs (color) and the previously known members (black) for Lupus, UCL, US, and V1062 Sco. Each panel indicates the number of sources for the respective PDF. Panels with (*) indicate that the null-hypothesis was rejected in at least one of the non-parametric statistic tests performed. |
| In the text | |
|
Fig. 12. Parallax over error (π/σπ) ve. RUWE of the three new groups of YSOs identified in this work, compared to sources with resolved protoplanetary disks (DSHARP, Andrews et al. 2018) and known binaries in Upper Sco (Tokovinin & Briceño 2020). |
| In the text | |
|
Fig. 13. Top and middle panels: spatial distribution along the line-of-sight of the new disk-bearing YSOs and previously known members (pkm) in Lupus or UCL, for three age groups (less than 4 Myr, between 4 Myr and 12 Myr, and greater than 12 Myr). Seven Lupus clouds are represented schematically by the filled colored ellipses. The 4 Myr travel radii is represented by dotted ellipses, centered on each cloud and is shown in the left columns; the middle columns show the same but for 12 Myr travel radii. Bottom panels: spatial distribution of new Lupus or UCL YSOs, and previous known members, superimposed on the PlanckAv map (the colorscale is the same as that shown in Fig. 1). The shaded red circles represent the 4 Myr and 12 Myr travel radii, for the left and middle panels, respectively. |
| In the text | |
|
Fig. 14. Overall proper motion and transverse velocity as a function of distance for the previously known members and new disk-bearing YSOs of the Lupus, UCL, and US groups. The data points denote the median values for each distance slice and the error bars corresponds to the respective median absolute deviation; the black data points correspond to values for the new disk-bearing YSOs in Lupus or UCL, while the orange data points correspond to values for the new disk-bearing YSOs in US. Each panel shows the corresponding median absolute deviation for known members for Lupus, US, and UCL (shaded bands). The dotted line in the bottom right panel corresponds to a linear fit to the transverse velocity over distance for the new YSO Lupus/UCL members: VT = 20 ± 1 km s−1. |
| In the text | |
|
Fig. C.1. Spatial distribution for the YSOs, and previously known members, for different distance slices, superimposed on the PlanckAV map (colorscale is the same as in Fig. 1). The Upper Sco and V1062 Sco regions are marked by dashed and solid lines, respectively. |
| In the text | |
|
Fig. D.1. Absolute magnitude vs. color for the previously known Upper Sco members (gray circles) and the new candidate members presented in this paper. The YSO symbols are the same as those shown in Fig. 4. The extinction-free isochrones correspond to 4 Myr (dashed line, dark gray) and 12 Myr (solid line, dark gray) (Marigo et al. 2017), with mass tracks of 0.1 M⊙, 0.4 M⊙, and 0.7 M⊙ for reference. |
| In the text | |
|
Fig. E.1. Absolute magnitude vs. color for the previously known V1062 Sco members (gray circles) and the new candidate members presented in this paper. The YSO symbols are the same as those shown in Fig. 4. The extinction-free isochrones correspond to 4 Myr (dashed line, dark gray) and 12 Myr (solid line, dark gray) (Marigo et al. 2017), with mass tracks of 0.1 M⊙, 0.4 M⊙, and 0.7 M⊙ for reference. |
| In the text | |
Current usage metrics show cumulative count of Article Views (full-text article views including HTML views, PDF and ePub downloads, according to the available data) and Abstracts Views on Vision4Press platform.
Data correspond to usage on the plateform after 2015. The current usage metrics is available 48-96 hours after online publication and is updated daily on week days.
Initial download of the metrics may take a while.