Fig. 13.
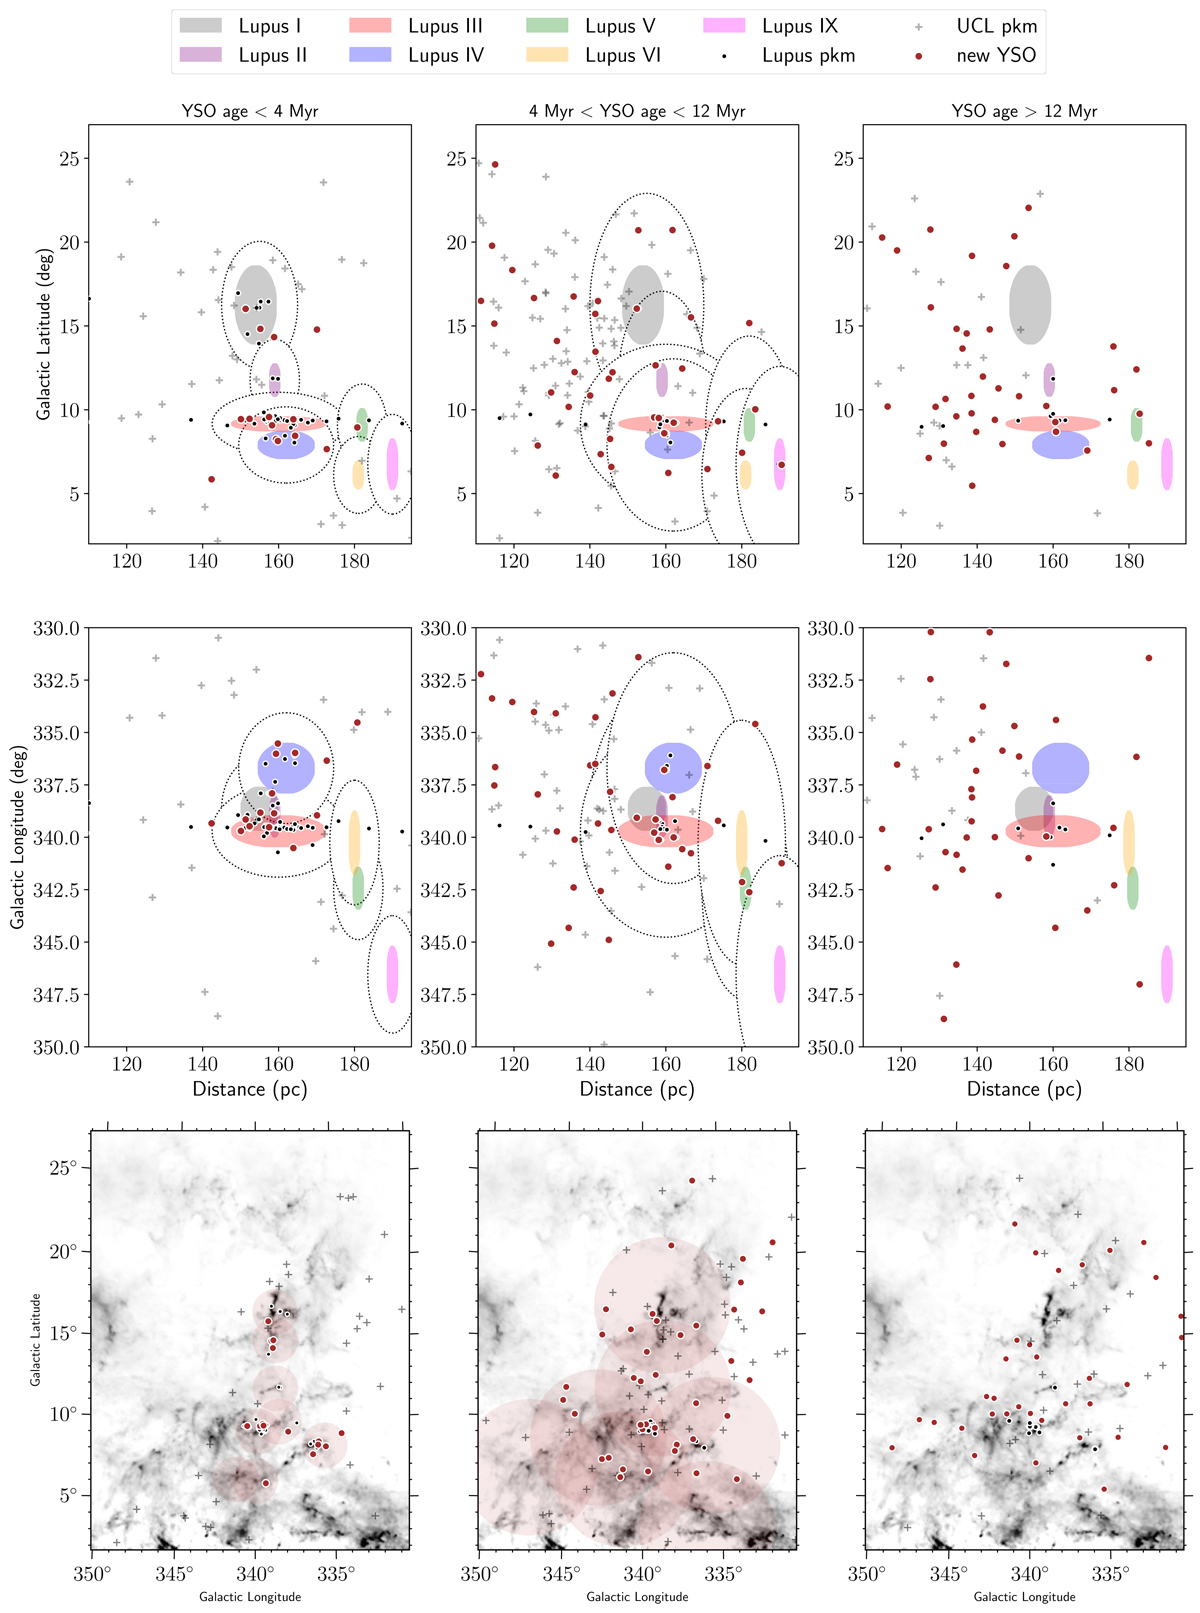
Top and middle panels: spatial distribution along the line-of-sight of the new disk-bearing YSOs and previously known members (pkm) in Lupus or UCL, for three age groups (less than 4 Myr, between 4 Myr and 12 Myr, and greater than 12 Myr). Seven Lupus clouds are represented schematically by the filled colored ellipses. The 4 Myr travel radii is represented by dotted ellipses, centered on each cloud and is shown in the left columns; the middle columns show the same but for 12 Myr travel radii. Bottom panels: spatial distribution of new Lupus or UCL YSOs, and previous known members, superimposed on the PlanckAv map (the colorscale is the same as that shown in Fig. 1). The shaded red circles represent the 4 Myr and 12 Myr travel radii, for the left and middle panels, respectively.
Current usage metrics show cumulative count of Article Views (full-text article views including HTML views, PDF and ePub downloads, according to the available data) and Abstracts Views on Vision4Press platform.
Data correspond to usage on the plateform after 2015. The current usage metrics is available 48-96 hours after online publication and is updated daily on week days.
Initial download of the metrics may take a while.