| Issue |
A&A
Volume 541, May 2012
|
|
|---|---|---|
| Article Number | L12 | |
| Number of page(s) | 5 | |
| Section | Letters | |
| DOI | https://doi.org/10.1051/0004-6361/201219207 | |
| Published online | 24 May 2012 | |
Detection of complex organic molecules in a prestellar core: a new challenge for astrochemical models⋆,⋆⋆
UJF-Grenoble 1 / CNRS-INSU, Institut de Planétologie et d’Astrophysique de
Grenoble (IPAG) UMR 5274,
38041
Grenoble,
France
e-mail: abacmann@ujf-grenoble.fr
Received: 12 March 2012
Accepted: 29 March 2012
Context. Complex organic molecules (COMs) have long been detected in the interstellar medium, especially in hot cores and in the hot corinos of low-mass protostars. Their formation routes however remain uncertain. Both warm gas-phase reactions and warm grain-surface reactions have been invoked to account for their presence in low-mass protostars. In this latter scheme, COMs result from radical-radical reactions on the grains as radicals become mobile when the nascent protostar warms up its surroundings and the resulting molecules are subsequently desorbed into the gas phase at higher temperatures.
Aims. Prestellar cores are the direct precursors of low-mass protostars and offer a unique opportunity to study the formation of COMs before the warm-up phase. Their very low temperatures (≤ 10 K) and the absence of any heating source or outflow exclude any efficient warm gas phase or warm dust chemistry, so that the presence of COMs in prestellar cores would have to originate from non-thermal chemical processes.
Methods. We used the IRAM 30 m telescope to look for four O-bearing COMs (acetaldehyde CH3CHO, dimethyl ether CH3OCH3, methyl formate CH3OCHO, and ketene CH2CO) in the prestellar core L1689B.
Results. We report the unambiguous detection of all four molecules in the cold gas phase of L1689B. These detections support the role played by non-thermal (possibly photolytic) processes in COM formation and desorption, though the presence of dimethyl ether is so far unexplained by current grain formation scenarios. The data show univocally that COM synthesis has already started at the prestellar stage and suggests at least part of the COMs detected in hot corinos have a prestellar origin.
Key words: astrochemistry / molecular processes / ISM: molecules / stars: formation
Based on observations carried out with the IRAM 30 m Telescope. IRAM is supported by INSU/CNRS (France), MPG (Germany), and IGN (Spain).
Appendices are available in electronic form at http://www.aanda.org
© ESO, 2012
1. Introduction
Complex organic molecules (COMs) have long been detected in the hot cores of massive star-forming regions such as Sgr B2 (Cummins et al. 1986) or OMC-1 (Blake et al. 1987). The warm central regions of low-mass protostars have been shown to harbour the same organic molecules (van Dishoeck et al. 1995; Cazaux et al. 2003), which led them to be called “hot corinos” (Bottinelli et al. 2004). In these regions, O- and N- bearing species like methyl formate (CH3OCHO), dimethyl ether (CH3OCH3) or acetonitrile (CH3CN) are abundant, so that these molecules have been designated as “hot core tracers”. The mechanisms leading to COM formation in star-forming regions are however still debated. COMs were first thought to be the result of warm gas-phase chemistry between ice mantle constituents, sometimes called primary species or parent molecules, which are evaporated in the gas phase in the vicinity of the nascent protostar (Charnley et al. 1992). In this scheme, primary molecules are formed on the grain ice mantles via successive hydrogenation of atoms or simple molecules like CO. When they are injected into the gas phase via thermal desorption, they can react and form secondary species like, e.g., CH3OCHO. The gas-phase scenario has been however challenged by experimental results showing that gas-phase formation pathways were much less efficient than originally thought (Horn et al. 2004, for methyl formate). Alternative scenarios have been proposed in which radicals are formed by ultraviolet (UV) irradiation of grain mantle molecules (e.g., Garrod & Herbst 2006) or trapped within the bulk of ice mantles of dust grains (Taquet et al. 2012). Following Garrod & Herbst (2006), the radicals can react on the grain mantles once the protostar starts heating its immediate surroundings and the grains reach a temperature of around 30–40 K, and form complex species on the grain, before they are being desorbed and released into the gas phase. Laboratory experiments however have shown the possibility to synthesize COMs such as methyl formate by irradiation (with UV photons or energetic particles) of methanol ices at temperatures as low as 10 K (Gerakines et al. 1996; Bennett & Kaiser 2007).
In contrast to warm star-forming regions such as hot cores or hot corinos, little research has been carried out to investigate the contents of cold gas. Studies of the dark cloud TMC-1 have revealed the presence of acetaldehyde (Matthews et al. 1985), ketene (Irvine et al. 1989), and methanol (Friberg et al. 1988). Evidence of COMs in prestellar cores is similarly scarce: Matthews et al. (1985) reported the detection of acetaldehyde in L183 (L134N), but searches for dimethyl ether (Friberg et al. 1988), ketene (Irvine et al. 1989) and methyl formate (Requena-Torres et al. 2007) only yielded upper limits. Despite their very low temperatures (~10 K), prestellar cores are however an important piece of the puzzle, as they represent the stage immediately before the gravitational collapse leading to protostar formation. They thus offer the opportunity to study the initial conditions of the star formation process. The relative simplicity of their structure (shallow temperature gradients, absence of inner heating source, absence of shocks or outflows, environment shielded from external radiation fields) makes them ideal targets to study chemical processes in cold gas at the very early stages of star formation.
We present here the first detection of the COMs dimethyl ether and methyl formate in a prestellar core, as well as the detection of the two other COMs acetaldehyde and ketene, in the gas phase at a temperature of ~10 K.
2. Observations
The target of our observation is the prestellar core L1689B. This source is a typical core characterised by low dust temperatures around 11−12 K (Kirk et al. 2007), high central densities of 105–106 cm-2, and a high central column density of ~1023 cm-2 (Bacmann et al. 2000; Dapp & Basu 2009). It was selected based on the assumption that the gas-phase abundances of C-bearing molecules such as formaldehyde (Bacmann et al. 2003) or methanol (Bacmann et al., in prep.) were relatively large with respect to other cores. Therefore, it can be hypothesised that COMs are more likely to be detected in this object than in more depleted ones.
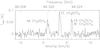 |
Fig. 1 CH3OCH3 spectrum at 99.325 GHz in the prestellar core L1689B. Three lines corresponding to the AA, EE, EA, and AE symmetry substates (AE and EA being at the same frequency) are clearly detected at the >7σ level. The vertical dotted lines indicate the rest frequencies measured in the laboratory and listed in the CDMS database (Müller et al. 2001). |
Observations were carried out in March 2011 at the IRAM 30 m telescope. We used the E090 receiver tuned to a frequency of 99.325 GHz (close to low energy transitions of CH3OCH3) to which we connected both the high resolution autocorrelator VESPA and the low resolution Fourier transform spectrometer (FTS). The spectral resolution and bandwidth of VESPA were 20 kHz (corresponding to a velocity resolution of ~0.06 km s-1) and 100 MHz, respectively. The FTS covered the whole 4 GHz receiver band (from 97.6 to 101.6 GHz in this case) with a spectral resolution of 192 kHz, corresponding to a velocity resolution of ~0.6 km s-1. The observations were carried out in the frequency switching mode with a frequency switch of 7.5 MHz to reduce standing waves. Pointing was checked every two hours on a nearby quasar and was found to be accurate to within 1″. The weather conditions were very good and system temperatures were typically 100−120 K despite the low elevation of the source. We integrated on the dust peak of the core L1689B, at  38′04.0″. The size of the telescope beam at the observing frequency was ~25″, and the forward and beam efficiencies were ηfwd = 0.95 and ηbeam = 0.80, respectively.
The data were reduced using the IRAM CLASS/GILDAS package1. The scans were coadded, deconvolved from the frequency switching procedure, and a low order (typically 3) polynomial was then fitted over line-free regions to correct for baseline oscillations. The spectra were converted from  to the Tmb scale, using the values of the efficiencies given above.
3. Results
The high spectral resolution spectrum obtained close to 99.325 GHz is shown in Fig. 1. The rms noise in the spectra is ~7 mK. The frequencies and spectroscopic parameters of the detected species are listed in Table A.1. Three spectral lines are clearly detected (to the 7−12σ level), corresponding to the 414−303 transitions of the four symmetry substates (AA-, EE-, AE-, and EA-) of CH3OCH3. The EA- and AE- transitions are only 2 kHz apart and therefore are indistinguishable in our spectrum. The lines are very narrow, ≃ 0.4 km s-1 wide, as expected for lines originating from cold gas at around 10 K. These spectra show the unambiguous presence in the cold gas of dimethyl ether, which is detected for the first time in a cold dark core.
The low-resolution spectrum covers the 97.6 GHz to 101.6 GHz region. Within this bandwidth, we also detect six lines of CH3OCHO (three lines of the A- and three lines of the E- substates), which had so far never been detected in a prestellar core. In addition, two lines of CH2CO (one ortho line and one para line) and two lines of CH3CHO (one of the A- and one of the E-substates) are also detected. Figures 2–4 present the spectra of CH3OCHO, CH3CHO, and CH2CO, respectively. Again, the detection of more than one line of each species at the measured catalog frequencies (see figures) is clear evidence of these three species in the gas phase of L1689B.
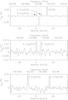 |
Fig. 2 CH3OCHO spectra of the 817−711 transitions at 100.48 GHz (A and E substates, bottom panel), of the 909−808 transitions at 100.68 GHz (A and E substates, middle panel), and of the 919−818 transitions at 100.08 GHz (A and E substates, top panel) in L1689B. The vertical dotted lines indicate the rest frequencies measured in the laboratory and listed in the JPL database (Pickett et al. 1998). The CH3OCHO spectrum in the top panel also shows a HC3N line. The negative spectral feature between both CH3OCHO lines results from the frequency switching procedure and the folding of the ortho-CH2CO line shown in Fig. 4. |
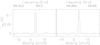 |
Fig. 3 CH3CHO spectra of the 514−413 transitions at 98.9009 GHz (A substate, left) and at 98.8633 GHz (E substate, right) in L1689B. The vertical dotted lines indicate the rest frequencies measured in the laboratory and listed in the JPL database (Pickett et al. 1998). |
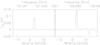 |
Fig. 4 CH2CO spectra of the 505−404 (para) transition at 101.0367 GHz (left) and of the 515−414 (ortho) transition (right) at 100.0945 GHz in L1689B. The vertical dotted lines indicate the laboratory rest frequencies listed in the CDMS database (Müller et al. 2001). |
At these low temperatures, the different substates have to be considered separately. Since we only have one line for each substate (except for methyl formate), the excitation conditions are poorly constrained and estimates of the column densities can only be given by assuming an excitation temperature. In the case of methyl formate, all detected lines have similar upper level energies and Einstein coefficients, so that having more than one line per substate does not bring supplementary constraints for the excitation. As these data are a subset of a larger ongoing observing project targetting several lines for each molecule and substate, we postpone the detailed analysis2 of the column densities and abundances to a future paper and give here only preliminary estimates of the column densities. At densities around 105–106 cm-3 (similar to the critical density of 106 cm-3), and gas temperatures of 7–10 K (Redman et al. 2004), it is reasonable to assume excitation temperatures of around 5 K. Because this value is uncertain, the column densities are also given for more extreme values of the excitation temperature, 4 K and 8 K.
The total column densities of the species were derived from the integrated line intensities assuming local thermodynamic equilibrium (see Appendix B for more details). The derived column densities are given in Table 1. The difference between the column density values at Tex = 4 K and Tex = 8 K varies between a factor of two for CH3OCH3 and an order of magnitude for CH3OCHO. It is reasonable to expect the same excitation temperature for the A- and E- substates of CH3CHO and CH3OCHO, as these have similar upper level energies, Einstein coefficients, frequencies, and upper level degeneracies. We find that both A- and E- substates are equally abundant in those two molecules. For CH3OCH3, we find the abundance ratio of the EE- to AA- substates to be equal to the statistical ratio of two, although no conclusion can be drawn about the AE- and EA- substates, as these are too close in values of frequency to be spectrally resolved, so we simply assumed that the ratio of their intensities was equal to the ratio of their upper level degeneracies (which leads to equal column densities in AE- and EA-, each equal to half that of the AA- substate – see note to Table 1). For CH2CO, we find an ortho-to-para ratio of ~3.3, which is similar to the value of 3.5 found in TMC-1 (Ohishi et al. 1991), consistent with the statistical ratio of 3. Assuming a H2 column density of 1023 cm-2 (Dapp & Basu 2009), we find abundances of a few 10-10 for the four species. This is a factor of ~100 lower than in hot corinos (e.g. in NGC1333-IRAS4A – Bottinelli et al. 2004), similar to the formaldehyde abundance ratio between prestellar cores (Bacmann et al. 2003) and hot corinos (Bottinelli et al. 2004).
4. Discussion and conclusions
The detection of CH3OCH3, CH3OCHO, CH2CO, and CH3CHO in the gas phase of a prestellar core at temperatures of around 10 K sheds new light on COM formation in the interstellar medium. Grain-surface chemistry models such as those of Garrod & Herbst (2006) require temperatures of around 30 K to ensure that the radicals present in the ice mantle have sufficient mobility to recombine and form COMs. This scenario cannot, however, explain the presence of COMs in the gas phase of this prestellar core. Pure gas-phase scenarios assuming that COMs result from warm (~100 K) gas-phase reactions between grain mantle constituents after their evaporation from the grains (Charnley et al. 1992) are also excluded by the low temperature in prestellar cores.
According to the hypothesis of a grain mantle formation scenario, the COMs that we detect in the gas phase have been desorbed from the ices by non-thermal processes such as secondary UV photon (originating from cosmic rays impacting on H2 molecules) heating, or direct cosmic-ray impacts. It is therefore possible that radical mobility on the grains is also provided by the energy brought to the grains by UV photons. Similar mechanisms were invoked by Öberg et al. (2010) who detected methyl formate in the protostar B1-b, possibly desorbed by UV originating from the protostar through an outflow cavity. In the case of L1689B, the gas is significantly colder than in B1-b, and the core is well-shielded from external UV, as there is no nearby protostar and no outflow cavity so that the core is not exposed to a direct UV field. In Galactic center clouds, the detection of COMs by Requena-Torres et al. (2006) in the gas phase has been interpreted as the result of the ejection of ice mantle molecules by either shocks or supersonic turbulence. This scheme does not apply to the prestellar core L1689B, in which there are no shocks and the levels of turbulence are very low, as demonstrated by the narrow linewidths. If COMs form on grains, the most likely mechanisms to bring radical mobility and lead to molecular desorption are thus secondary UVs, cosmic rays, or the release of chemical energy due to exothermic reactions on the grains (e.g. chemical explosions, Garrod et al. 2007).
The simultaneous detection of CH3OCH3 and CH3OCHO in very cold gas is particularly interesting. According to Öberg et al. (2011), COMs could form sequentially and CH3OCHO and CH3CHO are formed by UV irradiation of cold CO-rich ices and CH3OCH3 forms in warmer (CH3OH-rich) ice after CO has evaporated (see also Öberg et al. 2009). Our observations do not support this scenario, and show that either CH3OCH3 forms in the same ice as CH3OCHO (since prestellar core have rather uniform temperature and do not undergo temperature changes similar to those of protostars) or that the formation mechanisms of both types of molecules are different with, e.g., CH3OCH3 forming in the gas phase, as suggested by Peeters et al. (2006), though this idea is disputed by Requena-Torres et al. (2006).
The main conclusion of this paper is the detection of methyl formate and dimethyl ether for the first time in a very cold (~10 K) dark core, here the prestellar core L1689B. Acetaldehyde and ketene, which were previously detected in TMC-1, are also detected. The detection of these species is also further evidence that they do not specifically trace hot core or hot corino regions, but that they are also present in the cold and dense ISM. Since prestellar cores are thought to be the precursors of low-mass protostars, the presence of COMs at the prestellar stage means that we have to re-investigate COM formation scenario in protostars, especially in the case of dimethyl ether, which is not expected to form in similar ices as methyl formate. Following our results, it is likely that at least part of the COM contents in young protostars originates from the prestellar phase.
Online material
Appendix A: Spectroscopic line parameters
The frequencies, upper energy levels, upper level degeneracies, and Einstein coefficients of the observed transitions were taken from the JPL spectroscopic database (Pickett et al. 1998) and are summed up here in Table A.1.
Parameters of detected lines.
Appendix B: Column density determination
The column densities were determined within the LTE approximation, using 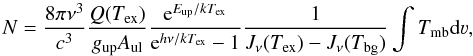 (B.1)where ν is the frequency of the transition, c the velocity of light, h and k the Planck and Boltzman constants, respectively, gup the upper level degeneracy, Aul the spontaneous emission Einstein coefficient, Tex the excitation temperature, Q(Tex) the partition function at Tex, Eup the upper level energy, and Jν(T) is the radiation temperature that is defined as
 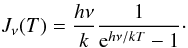 (B.2)Equation (B.1) assumes that the lines are optically thin. We note that since the temperatures are very low, Jν(Tbg) is not negligible with respect to Jν(Tex).
Note that collisional rates for methyl formate have been obtained by Faure et al. (2011).
Acknowledgments
This work has been supported by l’Agence Nationale pour la Recherche (ANR), France (contract ANR-08-BLAN-022).
References
- Bacmann, A., André, P., Puget, J.-L., et al. 2000, A&A, 361, 555 [Google Scholar]
- Bacmann, A., Lefloch, B., Ceccarelli, C., et al. 2003, ApJ, 585, L55 [NASA ADS] [CrossRef] [EDP Sciences] [Google Scholar]
- Bennett, C. J., & Kaiser, R. I. 2007, ApJ, 661, 899 [NASA ADS] [CrossRef] [Google Scholar]
- Blake, G. A., Sutton, E. C., Masson, C. R., & Phillips, T. G. 1987, ApJ, 315, 621 [NASA ADS] [CrossRef] [Google Scholar]
- Bottinelli, S., Ceccarelli, C., Lefloch, B., et al. 2004, ApJ, 615, 354 [NASA ADS] [CrossRef] [Google Scholar]
- Cazaux, S., Tielens, A. G. G. M., Ceccarelli, C., et al. 2003, ApJ, 593, L51 [NASA ADS] [CrossRef] [Google Scholar]
- Charnley, S. B., Tielens, A. G. G. M., & Millar, T. J. 1992, ApJ, 399, L71 [NASA ADS] [CrossRef] [Google Scholar]
- Cummins, S. E., Linke, R. A., & Thaddeus, P. 1986, ApJS, 60, 819 [NASA ADS] [CrossRef] [Google Scholar]
- Dapp, W. B., & Basu, S. 2009, MNRAS, 395, 1092 [NASA ADS] [CrossRef] [Google Scholar]
- Faure, A., Szalewicz, K., & Wiesenfeld, L. 2011, J. Chem. Phys., 135, 024301 [NASA ADS] [CrossRef] [PubMed] [Google Scholar]
- Friberg, P., Hjalmarson, A., Madden, S. C., & Irvine, W. M. 1988, A&A, 195, 281 [Google Scholar]
- Garrod, R. T., & Herbst, E. 2006, A&A, 457, 927 [NASA ADS] [CrossRef] [EDP Sciences] [Google Scholar]
- Garrod, R. T., Wakelam, V., & Herbst, E. 2007, A&A, 467, 1103 [NASA ADS] [CrossRef] [EDP Sciences] [Google Scholar]
- Gerakines, P. A., Schutte, W. A., & Ehrenfreund, P. 1996, A&A, 312, 289 [NASA ADS] [Google Scholar]
- Horn, A., Møllendal, H., Sekiguchi, O., et al. 2004, ApJ, 611, 605 [NASA ADS] [CrossRef] [Google Scholar]
- Irvine, W. M., Friberg, P., Kaifu, N., et al. 1989, ApJ, 342, 871 [Google Scholar]
- Kirk, J. M., Ward-Thompson, D., & André, P. 2007, MNRAS, 375, 843 [NASA ADS] [CrossRef] [Google Scholar]
- Matthews, H. E., Friberg, P., & Irvine, W. M. 1985, ApJ, 290, 609 [NASA ADS] [CrossRef] [PubMed] [Google Scholar]
- Müller, H. S. P., Thorwirth, S., Roth, D. A., & Winnewisser, G. 2001, A&A, 370, L49 [NASA ADS] [CrossRef] [EDP Sciences] [Google Scholar]
- Öberg, K. I., Garrod, R. T., van Dishoeck, E. F., & Linnartz, H. 2009, A&A, 504, 891 [NASA ADS] [CrossRef] [EDP Sciences] [Google Scholar]
- Öberg, K. I., Bottinelli, S., Jørgensen, J. K., & van Dishoeck, E. F. 2010, ApJ, 716, 825 [NASA ADS] [CrossRef] [Google Scholar]
- Öberg, K. I., van der Marel, N., Kristensen, L. E., & van Dishoeck, E. F. 2011, ApJ, 740, 14 [NASA ADS] [CrossRef] [Google Scholar]
- Ohishi, M., Kawaguchi, K., Kaifu, N., et al. 1991, in Atoms, Ions and Molecules: New Results in Spectral Line Astrophysics, ed. A. D. Haschick, & P. T. P. Ho, ASP Conf. Ser., 16, 387 [Google Scholar]
- Peeters, Z., Rodgers, S. D., Charnley, S. B., et al. 2006, A&A, 445, 197 [NASA ADS] [CrossRef] [EDP Sciences] [Google Scholar]
- Pickett, H. M., Poynter, R. L., Cohen, E. A., et al. 1998, JQSRT, 60, 883 [Google Scholar]
- Redman, M. P., Keto, E., Rawlings, J. M. C., & Williams, D. A. 2004, MNRAS, 352, 1365 [NASA ADS] [CrossRef] [Google Scholar]
- Requena-Torres, M. A., Martín-Pintado, J., Rodríguez-Franco, A., et al. 2006, A&A, 455, 971 [NASA ADS] [CrossRef] [EDP Sciences] [Google Scholar]
- Requena-Torres, M. A., Marcelino, N., Jiménez-Serra, I., et al. 2007, ApJ, 655, L37 [NASA ADS] [CrossRef] [Google Scholar]
- Taquet, V., Ceccarelli, C., & Kahane, C. 2012, A&A, 538, A42 [NASA ADS] [CrossRef] [EDP Sciences] [Google Scholar]
- van Dishoeck, E. F., Blake, G. A., Jansen, D. J., & Groesbeck, T. D. 1995, ApJ, 447, 760 [NASA ADS] [CrossRef] [Google Scholar]
All Tables
All Figures
|
Fig. 1 CH3OCH3 spectrum at 99.325 GHz in the prestellar core L1689B. Three lines corresponding to the AA, EE, EA, and AE symmetry substates (AE and EA being at the same frequency) are clearly detected at the >7σ level. The vertical dotted lines indicate the rest frequencies measured in the laboratory and listed in the CDMS database (Müller et al. 2001). |
| In the text | |
|
Fig. 2 CH3OCHO spectra of the 817−711 transitions at 100.48 GHz (A and E substates, bottom panel), of the 909−808 transitions at 100.68 GHz (A and E substates, middle panel), and of the 919−818 transitions at 100.08 GHz (A and E substates, top panel) in L1689B. The vertical dotted lines indicate the rest frequencies measured in the laboratory and listed in the JPL database (Pickett et al. 1998). The CH3OCHO spectrum in the top panel also shows a HC3N line. The negative spectral feature between both CH3OCHO lines results from the frequency switching procedure and the folding of the ortho-CH2CO line shown in Fig. 4. |
| In the text | |
|
Fig. 3 CH3CHO spectra of the 514−413 transitions at 98.9009 GHz (A substate, left) and at 98.8633 GHz (E substate, right) in L1689B. The vertical dotted lines indicate the rest frequencies measured in the laboratory and listed in the JPL database (Pickett et al. 1998). |
| In the text | |
|
Fig. 4 CH2CO spectra of the 505−404 (para) transition at 101.0367 GHz (left) and of the 515−414 (ortho) transition (right) at 100.0945 GHz in L1689B. The vertical dotted lines indicate the laboratory rest frequencies listed in the CDMS database (Müller et al. 2001). |
| In the text | |
Current usage metrics show cumulative count of Article Views (full-text article views including HTML views, PDF and ePub downloads, according to the available data) and Abstracts Views on Vision4Press platform.
Data correspond to usage on the plateform after 2015. The current usage metrics is available 48-96 hours after online publication and is updated daily on week days.
Initial download of the metrics may take a while.