Fig. 1
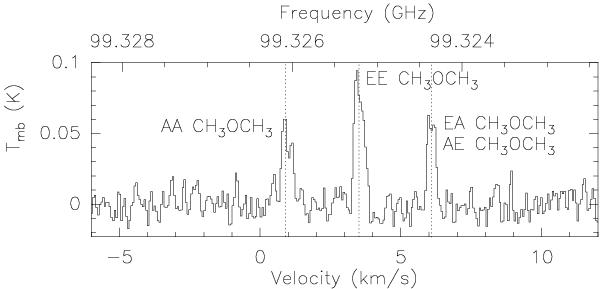
CH3OCH3 spectrum at 99.325 GHz in the prestellar core L1689B. Three lines corresponding to the AA, EE, EA, and AE symmetry substates (AE and EA being at the same frequency) are clearly detected at the >7σ level. The vertical dotted lines indicate the rest frequencies measured in the laboratory and listed in the CDMS database (Müller et al. 2001).
Current usage metrics show cumulative count of Article Views (full-text article views including HTML views, PDF and ePub downloads, according to the available data) and Abstracts Views on Vision4Press platform.
Data correspond to usage on the plateform after 2015. The current usage metrics is available 48-96 hours after online publication and is updated daily on week days.
Initial download of the metrics may take a while.