| Issue |
A&A
Volume 541, May 2012
|
|
|---|---|---|
| Article Number | L12 | |
| Number of page(s) | 5 | |
| Section | Letters | |
| DOI | https://doi.org/10.1051/0004-6361/201219207 | |
| Published online | 24 May 2012 | |
Online material
Appendix A: Spectroscopic line parameters
The frequencies, upper energy levels, upper level degeneracies, and Einstein coefficients of the observed transitions were taken from the JPL spectroscopic database (Pickett et al. 1998) and are summed up here in Table A.1.
Parameters of detected lines.
Appendix B: Column density determination
The column densities were determined within the LTE approximation, using 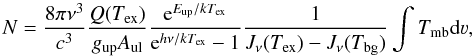 (B.1)where ν is the frequency of the transition, c the velocity of light, h and k the Planck and Boltzman constants, respectively, gup the upper level degeneracy, Aul the spontaneous emission Einstein coefficient, Tex the excitation temperature, Q(Tex) the partition function at Tex, Eup the upper level energy, and Jν(T) is the radiation temperature that is defined as
 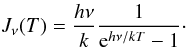 (B.2)Equation (B.1) assumes that the lines are optically thin. We note that since the temperatures are very low, Jν(Tbg) is not negligible with respect to Jν(Tex).
© ESO, 2012
Current usage metrics show cumulative count of Article Views (full-text article views including HTML views, PDF and ePub downloads, according to the available data) and Abstracts Views on Vision4Press platform.
Data correspond to usage on the plateform after 2015. The current usage metrics is available 48-96 hours after online publication and is updated daily on week days.
Initial download of the metrics may take a while.