Fig. 2
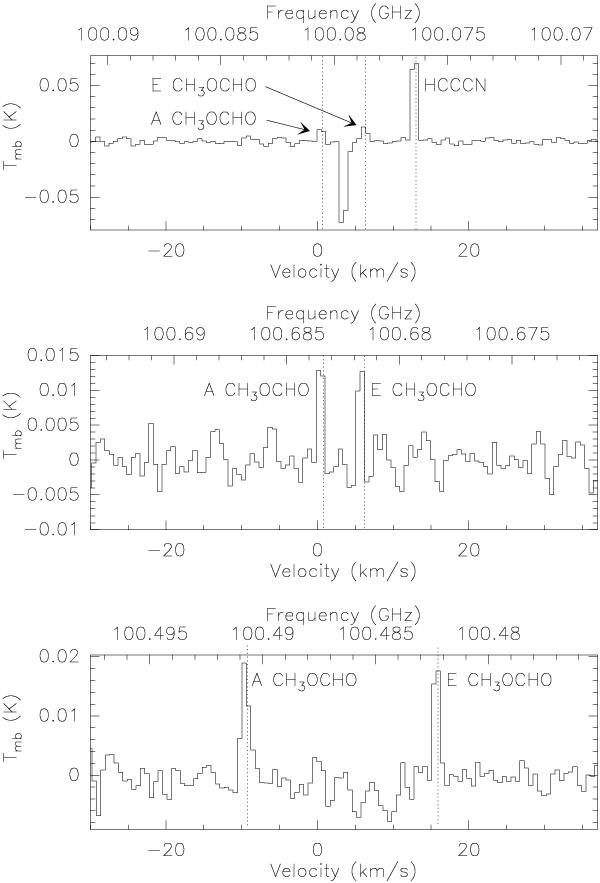
CH3OCHO spectra of the 817−711 transitions at 100.48 GHz (A and E substates, bottom panel), of the 909−808 transitions at 100.68 GHz (A and E substates, middle panel), and of the 919−818 transitions at 100.08 GHz (A and E substates, top panel) in L1689B. The vertical dotted lines indicate the rest frequencies measured in the laboratory and listed in the JPL database (Pickett et al. 1998). The CH3OCHO spectrum in the top panel also shows a HC3N line. The negative spectral feature between both CH3OCHO lines results from the frequency switching procedure and the folding of the ortho-CH2CO line shown in Fig. 4.
Current usage metrics show cumulative count of Article Views (full-text article views including HTML views, PDF and ePub downloads, according to the available data) and Abstracts Views on Vision4Press platform.
Data correspond to usage on the plateform after 2015. The current usage metrics is available 48-96 hours after online publication and is updated daily on week days.
Initial download of the metrics may take a while.