Free Access
Fig. 3
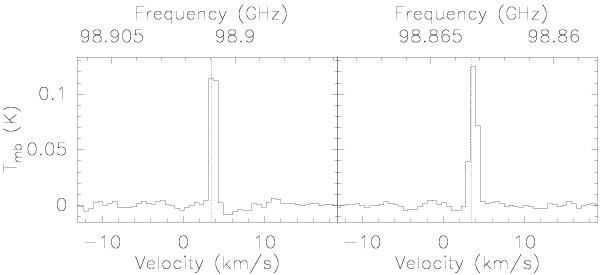
CH3CHO spectra of the 514−413 transitions at 98.9009 GHz (A substate, left) and at 98.8633 GHz (E substate, right) in L1689B. The vertical dotted lines indicate the rest frequencies measured in the laboratory and listed in the JPL database (Pickett et al. 1998).
Current usage metrics show cumulative count of Article Views (full-text article views including HTML views, PDF and ePub downloads, according to the available data) and Abstracts Views on Vision4Press platform.
Data correspond to usage on the plateform after 2015. The current usage metrics is available 48-96 hours after online publication and is updated daily on week days.
Initial download of the metrics may take a while.