| Issue |
A&A
Volume 695, March 2025
|
|
|---|---|---|
| Article Number | L10 | |
| Number of page(s) | 6 | |
| Section | Letters to the Editor | |
| DOI | https://doi.org/10.1051/0004-6361/202453563 | |
| Published online | 10 March 2025 | |
Letter to the Editor
Constraints on the X-ray-to-radio fluence ratio of FRB 20240114A
1
Julius-Maximilians-Universität Würzburg, Institut für Theoretische Physik und Astrophysik, Lehrstuhl für Astronomie, Emil-Fischer-Straße 31, D-97074 Würzburg, Germany
2
Max-Planck-Institut für Radioastronomie, Auf dem Hügel 69, D-53121 Bonn, Germany
3
Leibniz-Institut für Astrophysik Potsdam (AIP), An der Sternwarte 16, D-14482 Potsdam, Germany
4
Argelander Institute for Astronomy, Auf Dem Hügel 71, D-53121 Bonn, Germany
5
National Astronomical Research Institute of Thailand, Chiang Mai, Thailand
6
Centre of Astro-Engineering, Pontificia Universidad Catolica de Chile, Av. Vicuna Mackenna, 4860 Santiago, Chile
7
Department of Electrical Engineering, Pontificia Universidad Catolica de Chile, Av. Vicuna Mackenna, 4860 Santiago, Chile
8
European Southern Observatory, Karl-Schwarzschild-Str. 2, D-85748 Garching bei München, Germany
9
Joint ALMA Observatory, Alonso de Córdova, 3107 Vitacura, Santiago, Chile
10
Astropeiler Stockert e.V., Astropeiler 2-4, D-53902 Bad Münstereifel, Germany
11
LPC2E, OSUC, Univ Orléans, CNRS, CNES, Observatoire de Paris, F-45071 Orléans, France
⋆ Corresponding author; florian.eppel@uni-wuerzburg.de
Received:
20
December
2024
Accepted:
5
February
2025
We report on multiwavelength observations of FRB 20240114A, a nearby (z = 0.13), hyperactive, repeating fast radio burst that was discovered in January 2024. We performed simultaneous observations of the source with the Effelsberg 100-m radio telescope, the Thai National Radio Telescope, the Astropeiler Stockert, and the X-ray satellite XMM-Newton in May 2024. On May 23, 2024, we detected 459 bursts from the source using the Ultra-Broad-Band (UBB) receiver of the Effelsberg telescope, covering a frequency range from 1.3 GHz to 6 GHz. All bursts have simultaneous X-ray coverage, which allows us to put stringent constraints on the X-ray-to-radio fluence ratio, ηx/r, of FRB 20240114A. In this work, we focus on the three brightest radio bursts detected during the campaign. The brightest burst exhibits a radio fluence of 1.4 × 10⁻¹⁷ erg cm−2, while the 3σ upper limit of the 0.2−12 keV absorption-corrected X-ray burst fluence lies in the range of 3.4 × 10⁻¹¹ erg cm−2 to 1.7 × 10⁻¹⁰ erg cm−2, depending on the spectral model. Assuming a 10 keV black-body spectrum, the X-ray-to-radio fluence ratio can be constrained to ηx/r < 1.2 × 10⁷. A cutoff power law (Γ = 1.56, cutoff at 84 keV) is also considered, physically motivated by the Galactic magnetar SGR 1935+2154, which has previously shown X-ray bursts associated with FRB-like radio bursts at a measured X-ray-to-radio fluence ratio of ηx/r ∼ 2.5 × 10⁵ (1−250 keV). In this scenario, we find that ηx/r < 2.4 × 10⁶. Our results are consistent with FRB 20240114A being powered by a mechanism similar to that of SGR 1935+2154. We show that future multiwavelength campaigns will be able to improve this limit if sufficiently bright radio bursts are observed with simultaneous X-ray coverage.
Key words: radiation mechanisms: non-thermal / methods: data analysis / methods: observational / stars: magnetars / X-rays: bursts
© The Authors 2025
 Open Access article, published by EDP Sciences, under the terms of the Creative Commons Attribution License (https://creativecommons.org/licenses/by/4.0), which permits unrestricted use, distribution, and reproduction in any medium, provided the original work is properly cited.
This article is published in open access under the Subscribe to Open model. Subscribe to A&A to support open access publication.
1. Introduction
The origin of fast radio bursts (FRBs) is still unclear and a plethora of theoretical models have been suggested to explain these bright pulses of radio emission with millisecond duration (Platts et al. 2019). Several of the proposed models, especially those involving magnetars, predict associated multiwavelength (MWL) emission (e.g., Metzger et al. 2019; Lu et al. 2020). However, previous searches for X-ray or γ-ray counterparts of FRBs did not lead to any detection (Scholz et al. 2016, 2017, 2020; Pilia et al. 2020; Piro et al. 2021; Trudu et al. 2023; Pearlman et al. 2025; Yan et al. 2024; Cook et al. 2024). In early 2020, X-ray telescopes succeeded in detecting a high-energy transient signal coincident with an FRB-like burst (Tavani et al. 2021; Mereghetti et al. 2020; Bochenek et al. 2020; Li et al. 2021). The source of this signal was identified as the Galactic magnetar SGR 1935+2154, which exhibited several more simultaneous radio/X-ray flares (e.g., Ridnaia et al. 2021). This discovery showed for the first time that a magnetar can produce X-ray bursts in coincidence with FRB-like radio bursts, as had been predicted before (e.g., Metzger et al. 2019). It further suggests that coordinated radio and X-ray observations of FRBs may be able to detect coincident signals from other bright magnetar flares also in nearby extragalactic systems.
On January 26, 2024, the CHIME/FRB collaboration reported the discovery of the repeating FRB 20240114A (Shin & CHIME, FRB Collaboration 2024). Multiple follow-up observations throughout the following weeks found very bright bursts (Ould-Boukattine et al. 2024b; Pelliciari et al. 2024; Panda et al. 2024; Kumar et al. 2024; Zhang et al. 2024b), burst storms of several hundred bursts (Zhang et al. 2024a; Uttarkar et al. 2024; Ould-Boukattine et al. 2024a), and high-frequency radio detections up to 6 GHz (Joshi et al. 2024; Hewitt et al. 2024; Limaye & Spitler 2024). FRB 20240114A was localized to the dwarf star-forming galaxy SDSS J212739.84+041945.8 with sub-arcsecond precision (Tian et al. 2024; Snelders et al. 2024) at a redshift of z = 0.130 ± 0.002 (Bhardwaj et al. 2024).
Motivated by the high-fluence bursts, hyperactivity, and the possibility of detecting or constraining associated X-ray emission, we obtained target-of-opportunity observations of FRB 20240114A with the XMM-Newton X-ray satellite using director’s discretionary time (DDT). Additionally, we obtained simultaneous DDT radio observations with the Effelsberg 100-m telescope, the Thai National Radio Telescope (TNRT), and the Stockert Astropeiler. Here, we present the first results from this MWL campaign. In Sect. 2, we give an overview of the observations and analysis for all telescopes, in Sect. 3 we present results for the three brightest bursts detected in the campaign, and in Sect. 4 we discuss our findings in the broader context of FRB MWL studies.
2. Observations and analysis
The observations were split into three sessions. Two sessions were carried out with simultaneous observations by Stockert and XMM-Newton (May 17, 2024, and May 27, 2024) and one session (May 23, 2024) included TNRT, Effelsberg, Stockert, and XMM-Newton. An overview of the observing times on May 23, 2024, is shown in Fig. 1. In the following, we provide an overview of the observing setups and analysis performed for all telescopes.
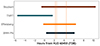 |
Fig. 1. Overview of the observing times (barycentric) and telescopes on May 23, 2024. For XMM-Newton-PN, the displayed time range corresponds to the GTIs. The three vertical lines indicate the arrival times of burst B1, B2, and B3. |
2.1. Effelsberg 100-m Telescope
We observed FRB 20240114A with the Effelsberg 100-m telescope on May 23, 2024, for ∼7 hours using the Ultra-Broad-Band (UBB) receiver, which covers a frequency range of 1.3−6 GHz with a system equivalent flux density (SEFD) of 12−16 Jy1. The data were recorded using the Effelsberg Direct Digitisation (EDD) backend (Barr et al. 2023) with a channel width of 0.5 MHz and time resolution of 128 μs. The data were recorded in five sub-bands (band 1: 1.3−1.9 GHz, band 2: 1.9−2.6 GHz, band 3: 3.0−4.1 GHz, band 4: 4.1−5.2 GHz, and band 5: 5.2−6.0 GHz). We searched the data for single bursts using TransientX (Men & Barr 2024) separately in every sub-band and found 459 unique bursts that could be identified as FRBs matched across sub-bands. For a detailed overview of the UBB data analysis, we refer to Appendix A.
2.2. Stockert Telescope
The Astropeiler Stockert is a 25-m telescope operating in the L band. The SEFD of the instrument is 385 Jy. Data was recorded as total-intensity 32-bit data with 98 MHz bandwidth (1332.25 MHz to 1430.5 MHz) and a time resolution of 218.45 μs using a fast Fourier transform backend (Barr et al. 2013). We searched for radio bursts using prepsubband and single_pulse_search from PRESTO (Ransom 2011). The threshold for single pulses was set to a signal-to-noise ratio (S/N) of 7, corresponding to a fluence threshold of ∼14 Jy ms for 1 ms wide pulses. The default boxcar size with 30 time bins (i.e., ∼6.5 ms) was used for the search. The data were filtered for RFI from nearby radar systems by applying the modulation index technique described by Spitler et al. (2012) and then classified using FETCH (Agarwal et al. 2020). The bursts flagged by FETCH as potential candidates were manually inspected. During the time of the observation reported here, no burst was detected. An additional manual inspection of the data was performed around the arrival time of the brightest Effelsberg burst (B1) with no convincing result. It has to be noted that on other observing days, bright burst (i.e., > 12 Jy ms) were detected using the analysis described above.
2.3. Thai National Radio Telescope
The TNRT is a 40-m radio telescope located at Doi Saket, Chiang Mai, Thailand, equipped with an EDD backend2. We performed pulsar search mode observations of FRB 20240114A on 23 May 2024 for ∼7 hours (see Fig. 1), using the L-band receiver centered at 1350 MHz with a bandwidth of 900 MHz, and time resolution of 51.2 μs. We used TransientX to search for single-pulses with DM 510−570 cm−3 pc. The S/N cutoff was set to 7 and pulse width threshold < 30 ms. After inspecting all candidates visually, no burst was found. This is consistent with the expected burst rate of 0.1–0.3 bursts/hour, assuming a conservative SEFD of 90 Jy (Jaroenjittichai et al. 2022).
2.4. XMM-Newton
We obtained XMM-Newton DDT observations that were carried out in three different time slots, on May 17, 2024 (Obs. ID 0935190601, 25.2 ks total observing time), May 23, 2024 (Obs.ID 0935190701, 25 ks), and May 27, 2024 (Obs.ID 0935191001, 28.7 ks). We used the PN- and MOS-instruments with medium filter in small window mode to achieve the best timing accuracy while also having good spatial resolution.
The data for the PN- and MOS-instruments were processed using the XMM-Newton Science Analysis System (SAS, Gabriel et al. 2004) version 21.0.0. We used the pipelines epproc for the PN-camera and emproc for the MOS-cameras to generate filtered event lists. We performed the barycentric correction using the barycen task. Additionally, we identified times of flaring background by analyzing the light curves at 10−15 keV energies. By applying conservative cuts to the background count rate, we identified the final good time intervals (GTIs) to use for the analysis of the persistent flux limit, totaling 57.3 ks. The event lists were extracted in the energy band 0.2−12 keV. Additionally, we performed an astrometric pointing correction using the eposcorr task (see Appendix B).
3. Results
3.1. Radio bursts
During the Effelsberg observation on May 23, 2024, we detected 459 bursts from FRB 20240114A. None of these bursts were seen by TNRT or Stockert. In UBB band 1, which overlaps with TNRT and Stockert, we detected 186 bursts, all except B1 with S/N < 50. The brightest burst overlapping with TNRT was detected with S/N = 34.2. Given the sensitivity of Effelsberg, which is superior by a factor of ∼6 to TNRT and ∼25 to Stockert, and its broader frequency coverage, the non-detection with Stockert and TNRT is expected. In the additional two XMM-Newton sessions that were covered only by Stockert, no bursts were found.
In this work, we present the three brightest bursts (labeled B1, B2, and B3) detected at an S/N > 100 with Effelsberg, which are shown in Fig. 2 as waterfall plots. In the case of a constant X-ray-to-radio fluence ratio, ηx/r, these are the best candidates to constrain possibly associated X-ray emission. We combined all sub-bands of the UBB receiver in which significant emission of the burst was detected. For burst B1 and B3, this corresponds to sub-band 1 and 2, while B2 shows significant emission in sub-bands 3 and 4. Burst B1 shows temporal substructure, divided into three sub-bursts that follow the characteristic so-called sad-trombone scheme (e.g., Katz 2023). Bursts B2 and B3 are single bursts without visible subcomponents. To calculate the fluence of each burst, we first averaged the flux density over the observing bandwidth, excluding RFI-flagged channels and then integrated the flux density over a time window covering the full burst (see Fig. 2). The resulting fluences are shown in Table 1. In order to compare the radio burst properties with X-ray observations, we calculated the bandwidth-integrated fluence, also referred to as the “radio burst fluence”, ℱR (e.g. Pearlman et al. 2025; Cook et al. 2024). This quantity is calculated by integrating the fluence over the observing bandwidth (excluding RFI-flagged channels).
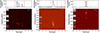 |
Fig. 2. Waterfall plots of the three brightest bursts from FRB 20240114A that were detected simultaneous to the XMM-Newton observation on May 23, 2024 (left: B1, center: B2, right: B3). RFI-flagged channels are highlighted by the gray lines on the left. The top panel shows the flux density, averaged over the displayed bandwidth, excluding RFI-flagged channels, and the time windows used for the fluence calculation (red lines). The displayed bandwidth for B1 and B3 covers UBB sub-bands 1 and 2, while B2 is shown in UBB sub-bands 3 and 4. The color maps are scaled individually for every burst from minimum to maximum flux density. |
Overview of the three brightest bursts detected within our MWL campaign.
By using the known redshift of the host galaxy of FRB 20240114A (z = 0.13, Bhardwaj et al. 2024) and assuming a flat Lambda-CDM model (Planck Collaboration VI 2020), we calculated the intrinsic radio burst release energy, ER, for every burst, following Zhang (2018). The values obtained are displayed in Table 1. The brightest burst in our observations, B1, summed over all three subcomponents, exhibits a radio burst fluence of ℱR, B1 = 1.4 × 10⁻¹⁷ erg cm−2, which translates to a total release energy of ER, B1 = 5.8 × 1038 erg. We note that all of these values must be understood as lower limits, since parts of the burst emission exceed the receiver bandwidth (at least for B1) and multiple channels within the burst bandwidth needed to be flagged due to RFI and could therefore not be considered.
3.2. X-ray burst emission
We checked the PN-event list (0.2−12 keV) for X-ray photons at the times of radio bursts B1−B3. We used an extraction region with a radius of 0.01° (i.e., 90% encircled energy fraction at 1.5 keV) centered on the position of FRB 20240114A (RA = 21h27m39.835s, Dec = +04d19m45.634s; Snelders et al. 2024). This analysis was done on the non-background-corrected data with an average background count rate in this region of ∼3 × 10⁻² cps. For burst B1, the closest X-ray photon after the burst was detected 48 s after the radio emission, for burst B2 50 s after the radio emission, and for burst B3 17 s. This is consistent with the expected background rate; hence, we conclude that none of the bursts are detected significantly at X-ray energies.
In order to derive an upper limit on the burst X-ray flux for each of the radio bursts, we used a similar method as described by Cook et al. (2024). We estimated the background rate at the position of FRB 20240114A using a 200 s window centered on the time of arrival of the burst. By applying low-count photon statistics using the pwkit library (Williams et al. 2017), following Kraft et al. (1991), we derived a 3σ (i.e., 99.73% one-sided confidence level) upper limit of 5.9 photons at the time of the radio burst, or 6.5 photons when correcting for the 90% encircled energy fraction. Considering a typical duration of magnetar-associated X-ray bursts of ∼100 ms as seen in SGR 1935+2154 (Mereghetti et al. 2020), a cutoff power law spectrum (Γ = 1.56, cutoff 84 keV) as observed in SGR 1935+2154 (Li et al. 2021), and an average Galactic hydrogen column density of NH = 5.0 × 1020 cm−2 in the direction of FRB 20240114A (HI4PI Collaboration 2016), this translates to a 3σ upper limit to the X-ray fluence of ℱX < 3.4 × 10⁻¹¹ erg cm−2 in the 0.2−12 keV band, corrected for Galactic absorption (following Appendix A of Tubín-Arenas et al. 2024). The corresponding upper limit on the intrinsic total X-ray energy release is EX < 1.5 × 1045 erg (0.2−12 keV). Assuming a 10 keV black-body spectrum (cf., Cook et al. 2024), the 3σ upper limit to the X-ray fluence is ℱX < 1.7 × 10⁻¹⁰ erg cm−2 (EX < 7.2 × 1045 erg) in the 0.2−12 keV band, corrected for Galactic absorption.
We used the radio burst fluences, ℱR, and the upper limit on the X-ray burst fluence, ℱX, to calculate upper limits on the X-ray-to-radio fluence ratio, ηx/r = ℱX/ℱR. This fluence ratio always corresponds to specific observing bandwidths in the radio and X-ray. The fluence ratios for the three brightest bursts in our observing campaign are shown in Table 1. The most constraining limit can be obtained from burst B1, yielding a fluence ratio of ηx/r < 2.4 × 10⁶ at 3σ confidence, assuming a spectrum similar to SGR 1935+2154. The assumption of a 10 keV black-body spectrum leads to a less stringent limit of ηx/r < 1.2 × 10⁷.
3.3. Persistent X-ray emission
To constrain the X-ray flux of a possible persistent source associated with FRB 20240114A, we selected events coming from its position with a radius of 0.01° in an energy range of 0.2−12 keV. We defined background regions next to the position of the FRB without any X-ray sources to compare the number of collected photons at the position of the FRB with the background expectation. Following Kraft et al. (1991), we calculated a 3σ upper limit on the persistent X-ray flux using 57.3 ks of GTI PN-data. We find a 3σ upper limit of < 2.4 × 10⁻³ cps, corrected for the encircled energy fraction. Assuming a power law spectrum with Γ = 2 and the same NH as in Sect. 3.2, this corresponds to a persistent X-ray flux limit of < 1.0 × 10⁻¹⁴ erg cm−2 s−1 and an isotropic luminosity of ℒX < 4.3 × 1041 erg s−1 (0.2−12 keV).
4. Discussion
4.1. Comparison with other multiwavelength FRB studies
In this section, we compare our results to MWL observations of other FRBs, mainly focusing on a recent publication by Cook et al. (2024), which includes an overview of many previous studies. We note that in all previous studies, no significant X-ray emission (either persistent or burst-like) was found. Cook et al. (2024) used X-ray fluences and energies in the 0.5−10 keV band. We therefore converted our limits on the X-ray burst fluence from Sect. 3 to this band. In the 0.5−10 keV energy range, the upper limit on the X-ray burst fluence corresponds to 2.7 × 10⁻¹¹ erg cm−2 (cutoff power law) or 1.1 × 10⁻¹⁰ erg cm−2 (black-body), assuming the same spectral models as in Sect. 3.
For the single burst X-ray fluence limits at the time of the radio bursts, we used a similar analysis as presented by Cook et al. (2024). Their upper limits are ∼35% higher for the black-body spectrum scenario, which can be explained by the different NH values assumed. While Cook et al. (2024) use a conservative value of NH = 1022 cm−2, trying to account for absorption at the source, we use the average hydrogen column density of NH = 5.0 × 1020 cm−2 in the direction of FRB 20240114A (HI4PI Collaboration 2016). Assuming the more conservative value of NH = 1022 cm−2, our upper limit for the single burst X-ray fluence increases to 1.2 × 10⁻¹⁰ erg cm−2 for a black-body spectral model (0.5−10 keV). This value is still slightly lower than the limit obtained by Cook et al. (2024), which is likely due to the fact that we initially extracted a larger energy band of 0.2−12 keV from the XMM-Newton data and then downsampled to the 0.5−10 keV band. Moreover, it is unclear if Cook et al. (2024) used the same count-to-flux conversion as we did, based on Tubín-Arenas et al. (2024).
According to Cook et al. (2024), the most constraining fluence ratio limit (0.5−10 keV) for a single FRB to date was found at ηx/r < 7 × 10⁶ for FRB 20220912A and FRB 20180916B (Pilia et al. 2020), assuming a 10 keV black-body X-ray spectrum. Our best limit obtained from the brightest burst B1 (ηx/r < 2.4 × 10⁶) is three times lower than this, but considers a different X-ray energy band (0.2−12 keV), different spectral model (cutoff power law), and different absorption.
While the assumption of a blackbody spectrum is motivated by observations of hard X-ray bursts from magnetars (e.g., An et al. 2014; Coti Zelati et al. 2021), X-ray emission from SGR 1935+2154 suggests a nonthermal cutoff power law (Li et al. 2021). It is thus unclear which spectrum should be assumed. Using a blackbody model like Cook et al. (2024), the limit from burst B1 transforms to ηx/r < 8.5 × 10⁶ at 0.5−10 keV. This is comparable to the lowest single burst limits found for FRB 20220912A and FRB 20180916B. The limit can be further constrained by applying a stacking approach (e.g., Cook et al. 2024); however, this requires an accurate flux calibration of all 459 bursts and will be done in a separate publication.
4.2. Constraints on magnetars as progenitors
With an X-ray-to-radio fluence ratio of ηx/r < 2.4 × 10⁶, we cannot rule out the currently favored FRB production models, based on magnetars. As pointed out by Cook et al. (2024), most magnetar-based models predict ηx/r ≈ 100 − 104 (e.g., Margalit et al. 2020; Lu et al. 2020; Popov et al. 2010). Moreover, the X-ray-to-radio fluence ratio from the Galactic magnetar SGR 1935+2154 was observed to be ηx/r ∼ 2.5 × 10⁵ (1−250 keV, Bochenek et al. 2020; Li et al. 2021), which is still well below the most constraining upper limit for ηx/r found for any extragalactic FRB. Corrected for typical XMM-Newton observing bands (0.2−12 keV, cutoff power law, Γ = 1.56, cutoff 84 keV), the expected ηx/r from SGR 1935+2154 is even lower, by a factor of ∼3. Therefore, our observations are consistent with FRB 20240114A being powered by a magnetar, in agreement with synchrotron maser models (e.g. Metzger et al. 2019; Margalit et al. 2020) and magnetospheric emission models (e.g., Lu et al. 2020; Zhong et al. 2024). However, it is unlikely that FRB 20240114A exhibits pulsed radio emission with anti-aligned X-ray pulses as seen in SGR 1935+2154 (Zhu et al. 2023), which requires ηx/r ∼ (7 − 12)×106 (Cook et al. 2024).
5. Summary and outlook
We observed the repeating FRB 20240114A with the Effelsberg 100-m telescope, the TNRT, the Astropeiler Stockert, and the X-ray satellite XMM-Newton. On May 23, 2024, we detected 459 radio bursts from FRB 20240114A using the Effelsberg UBB receiver, covering a frequency range from 1.3−6 GHz. In this work, we have presented the three brightest bursts, detected with S/N > 100. The brightest burst (B1, see Fig. 2) exhibits a radio fluence of 1.4 × 10⁻¹⁷ erg cm−2. None of the bursts were detected with XMM-Newton, Stockert, or TNRT. We used the XMM-Newton observations to derive upper fluence limits for associated X-ray bursts lasting 100 ms, which can be constrained to ℱX < 3.4 × 10⁻¹¹ erg cm−2 in the 0.2−12 keV band at 3σ confidence. This corresponds to an X-ray-to-radio fluence ratio of ηx/r < 2.4 × 10⁶ for the brightest burst. Considering different magnetar models for FRBs, which predict associated X-ray emission (e.g. Metzger et al. 2019; Margalit et al. 2020; Lu et al. 2020; Zhong et al. 2024), this limit is consistent with FRB 20240114A being powered by a magnetar. Moreover, from the MWL detection of radio and X-ray bursts from the Galactic magnetar SGR 1935+2154, one expects ηx/r ∼ 2.5 × 10⁵ (1–250 keV, Bochenek et al. 2020; Li et al. 2021), which is in agreement with our limit. That means FRB 20240114A could be powered by a similar mechanism as SGR 1935+2154. In a follow-up publication, we are planning to stack all 459 bursts to derive an even lower limit for the X-ray/radio fluence ratio. Given the extremely bright bursts from FRB 20240114A reported, for example, by Shin & CHIME, FRB Collaboration (2024), and its hyperactivity, it is a prime target for future MWL studies. While future studies with current X-ray telescopes will not be able to place significantly lower X-ray flux limits, the detection of more energetic radio bursts up to a factor of 10−100 times brighter than the ones found in our campaign is possible (e.g., Kirsten et al. 2024) and would result in superior constraints on ηx/r, reaching the value found for SGR 1935+2154.
Acknowledgments
We thank the anonymous referee for valuable comments that helped us improve the manuscript. We thank Amanda Cook for helpful discussions on the X-ray count-to-flux conversion. This work is based on observations with the 100-m telescope of the MPIfR (Max-Planck-Institut für Radioastronomie) at Effelsberg. FE and MKa acknowledge support from the Deutsche Forschungsgemeinschaft (DFG, grant 447572188), and MKr from the German Aerospace Center (DLR, grant FKZ 50 OR 2307). LGS is a Lise Meitner research group leader and acknowledges support from the Max Planck Society. MC is a Max-Planck partner group leader and acknowledges support from Max-Planck society. Based on observations obtained with XMM-Newton, an ESA science mission with instruments and contributions directly funded by ESA Member States and NASA. This research is partially based on observations made with the 40-m Thai National Radio Telescope at the Thai National Radio Astronomy Observatory under the open-use program ID ToO1 (Target of Opportunity 1), which is operated by the National Astronomical Research Institute of Thailand (Public Organization). This research has made use of the Astrophysics Data System, funded by NASA under Cooperative Agreement 80NSSC21M00561. We thank the NARIT and MPIfR teams for providing the new capabilities used at TNRT and Effelsberg. The TNRT L-band receiver and USB system were developed in collaboration between the MPIfR and NARIT. The Effelsberg UBB receiver and EDD system are developed and maintained by the electronics division at the MPIfR.
References
- Agarwal, D., Aggarwal, K., Burke-Spolaor, S., Lorimer, D. R., & Garver-Daniels, N. 2020, MNRAS, 497, 1661 [Google Scholar]
- An, H., Kaspi, V. M., Beloborodov, A. M., et al. 2014, ApJ, 790, 60 [NASA ADS] [CrossRef] [Google Scholar]
- Barr, E. D., Champion, D. J., Kramer, M., et al. 2013, MNRAS, 435, 2234 [NASA ADS] [CrossRef] [Google Scholar]
- Barr, E. D., Bansod, A., Behrend, J., et al. 2023, 2023 XXXVth General Assembly and Scientific Symposium of the International Union of Radio Science (URSI GASS), We-J01-PM3-4 [Google Scholar]
- Bhardwaj, M., Kirichenko, A., & Gil de Paz, A. 2024, The Astronomer’s Telegram, 16613, 1 [Google Scholar]
- Bochenek, C. D., Ravi, V., Belov, K. V., et al. 2020, Nature, 587, 59 [NASA ADS] [CrossRef] [Google Scholar]
- Cook, A. M., Scholz, P., Pearlman, A. B., et al. 2024, ApJ, 974, 170 [NASA ADS] [CrossRef] [Google Scholar]
- Coti Zelati, F., Borghese, A., Israel, G. L., et al. 2021, ApJ, 907, L34 [NASA ADS] [CrossRef] [Google Scholar]
- Gabriel, C., Denby, M., Fyfe, D. J., et al. 2004, in Astronomical Data Analysis Software and Systems (ADASS) XIII, eds. F. Ochsenbein, M. G. Allen, & D. Egret, ASP Conf. Ser., 314, 759 [NASA ADS] [Google Scholar]
- Gaia Collaboration (Vallenari, A., et al.) 2023, A&A, 674, A1 [NASA ADS] [CrossRef] [EDP Sciences] [Google Scholar]
- Hessels, J. W. T., Spitler, L. G., Seymour, A. D., et al. 2019, ApJ, 876, L23 [Google Scholar]
- Hewitt, D. M., Huang, J., Hessels, J. W. T., et al. 2024, The Astronomer’s Telegram, 16597, 1 [Google Scholar]
- HI4PI Collaboration (Ben Bekhti, N., et al.) 2016, A&A, 594, A116 [NASA ADS] [CrossRef] [EDP Sciences] [Google Scholar]
- Jaroenjittichai, P., Sugiyama, K., Kramer, B. H., et al. 2022, ArXiv e-prints [arXiv:2210.04926] [Google Scholar]
- Joshi, P., Medina, A., Earwicker, J. T., et al. 2024, The Astronomer’s Telegram, 16599, 1 [Google Scholar]
- Katz, J. I. 2023, MNRAS, 518, 2015 [Google Scholar]
- Kirsten, F., Ould-Boukattine, O. S., Herrmann, W., et al. 2024, Nature Astronomy, 8, 337 [NASA ADS] [CrossRef] [Google Scholar]
- Kraft, R. P., Burrows, D. N., & Nousek, J. A. 1991, ApJ, 374, 344 [Google Scholar]
- Kumar, A., Maan, Y., & Bhusare, Y. 2024, The Astronomer’s Telegram, 16452, 1 [Google Scholar]
- Kurpas, J., Schwope, A. D., Pires, A. M., & Haberl, F. 2024, A&A, 683, A164 [NASA ADS] [CrossRef] [EDP Sciences] [Google Scholar]
- Li, C. K., Lin, L., Xiong, S. L., et al. 2021, Nature Astronomy, 5, 378 [CrossRef] [Google Scholar]
- Limaye, P., & Spitler, L. 2024, The Astronomer’s Telegram, 16620, 1 [Google Scholar]
- Lu, W., Kumar, P., & Zhang, B. 2020, MNRAS, 498, 1397 [NASA ADS] [CrossRef] [Google Scholar]
- Luo, J., Ransom, S., Demorest, P., et al. 2021, ApJ, 911, 45 [NASA ADS] [CrossRef] [Google Scholar]
- Margalit, B., Beniamini, P., Sridhar, N., & Metzger, B. D. 2020, ApJ, 899, L27 [NASA ADS] [CrossRef] [Google Scholar]
- Men, Y., & Barr, E. 2024, A&A, 683, A183 [NASA ADS] [CrossRef] [EDP Sciences] [Google Scholar]
- Mereghetti, S., Savchenko, V., Ferrigno, C., et al. 2020, ApJ, 898, L29 [Google Scholar]
- Metzger, B. D., Margalit, B., & Sironi, L. 2019, MNRAS, 485, 4091 [NASA ADS] [CrossRef] [Google Scholar]
- Morello, V., Barr, E. D., Cooper, S., et al. 2019, MNRAS, 483, 3673 [NASA ADS] [CrossRef] [Google Scholar]
- Ould-Boukattine, O. S., Dijkema, T. J., Gawronski, M., et al. 2024a, The Astronomer’s Telegram, 16565, 1 [Google Scholar]
- Ould-Boukattine, O. S., Hessels, J. W. T., Kirsten, F., et al. 2024b, The Astronomer’s Telegram, 16432, 1 [Google Scholar]
- Panda, U., Bhattacharyya, S., Dudeja, C., Kudale, S., & Roy, J. 2024, The Astronomer’s Telegram, 16494, 1 [Google Scholar]
- Pearlman, A. B., Scholz, P., Bethapudi, S., et al. 2025, Nature Astronomy, 9, 111 [Google Scholar]
- Pelliciari, D., Geminardi, A., Bernardi, G., et al. 2024, The Astronomer’s Telegram, 16547, 1 [Google Scholar]
- Perley, R. A., & Butler, B. J. 2017, ApJS, 230, 7 [NASA ADS] [CrossRef] [Google Scholar]
- Pilia, M., Burgay, M., Possenti, A., et al. 2020, ApJ, 896, L40 [NASA ADS] [CrossRef] [Google Scholar]
- Piro, L., Bruni, G., Troja, E., et al. 2021, A&A, 656, L15 [NASA ADS] [CrossRef] [EDP Sciences] [Google Scholar]
- Planck Collaboration VI 2020, A&A, 641, A6 [NASA ADS] [CrossRef] [EDP Sciences] [Google Scholar]
- Platts, E., Weltman, A., Walters, A., et al. 2019, Phys. Rep., 821, 1 [NASA ADS] [CrossRef] [Google Scholar]
- Popov, S. B., & Postnov, K. A. 2010, in Evolution of Cosmic Objects through their Physical Activity, eds. H. A. Harutyunian, A. M. Mickaelian, & Y. Terzian, 129 [Google Scholar]
- Ransom, S. 2011, Astrophysics Source Code Library [record ascl:1107.017] [Google Scholar]
- Ridnaia, A., Svinkin, D., Frederiks, D., et al. 2021, Nature Astronomy, 5, 372 [CrossRef] [Google Scholar]
- Scholz, P., Spitler, L. G., Hessels, J. W. T., et al. 2016, ApJ, 833, 177 [CrossRef] [Google Scholar]
- Scholz, P., Bogdanov, S., Hessels, J. W. T., et al. 2017, ApJ, 846, 80 [NASA ADS] [CrossRef] [Google Scholar]
- Scholz, P., Cook, A., Cruces, M., et al. 2020, ApJ, 901, 165 [CrossRef] [Google Scholar]
- Seymour, A., Michilli, D., & Pleunis, Z. 2019, Astrophysics Source Code Library [record ascl:1910.004] [Google Scholar]
- Shin, K., & CHIME, FRB Collaboration 2024, The Astronomer’s Telegram, 16420, 1 [Google Scholar]
- Snelders, M. P., Bhandari, S., Kirsten, F., et al. 2024, The Astronomer’s Telegram, 16542, 1 [Google Scholar]
- Spitler, L. G., Cordes, J. M., Chatterjee, S., & Stone, J. 2012, ApJ, 748, 73 [CrossRef] [Google Scholar]
- Tavani, M., Casentini, C., Ursi, A., et al. 2021, Nature Astronomy, 5, 401 [CrossRef] [Google Scholar]
- Tian, J., Rajwade, K. M., Pastor-Marazuela, I., et al. 2024, MNRAS, 533, 3174 [NASA ADS] [CrossRef] [Google Scholar]
- Trudu, M., Pilia, M., Nicastro, L., et al. 2023, A&A, 676, A17 [NASA ADS] [CrossRef] [EDP Sciences] [Google Scholar]
- Tubín-Arenas, D., Krumpe, M., Lamer, G., et al. 2024, A&A, 682, A35 [NASA ADS] [CrossRef] [EDP Sciences] [Google Scholar]
- Uttarkar, P. A., Kumar, P., Lower, M. E., & Shannon, R. M. 2024, The Astronomer’s Telegram, 16430, 1 [Google Scholar]
- van Straten, W., & Bailes, M. 2011, PASA, 28, 1 [Google Scholar]
- van Straten, W., Demorest, P., & Oslowski, S. 2012, Astronomical Research and Technology, 9, 237 [NASA ADS] [Google Scholar]
- Williams, P. K. G., Clavel, M., Newton, E., & Ryzhkov, D. 2017, Astrophysics Source Code Library [record ascl:1704.001] [Google Scholar]
- Yan, Z., Yu, W., Page, K. L., et al. 2024, ApJ, submitted [arXiv:2402.12084] [Google Scholar]
- Zhang, B. 2018, ApJ, 867, L21 [NASA ADS] [CrossRef] [Google Scholar]
- Zhang, J., Wu, Q., Cao, S., et al. 2024a, The Astronomer’s Telegram, 16505, 1 [Google Scholar]
- Zhang, J., Zhu, Y., Cao, S., et al. 2024b, The Astronomer’s Telegram, 16433, 1 [Google Scholar]
- Zhong, S.-Q., Li, L., Zhang, B., & Dai, Z.-G. 2024, ApJ, 976, 52 [NASA ADS] [CrossRef] [Google Scholar]
- Zhu, W., Xu, H., Zhou, D., et al. 2023, Science Advances, 9, eadf6198 [NASA ADS] [CrossRef] [Google Scholar]
Appendix A: Effelsberg UBB data analysis
The UBB receiver delivers PSRFITS files for every sub-band, which were searched for single bursts using TransientX (Men & Barr 2024) separately in every sub-band. We performed a search for short bursts with a maximum width of 10 ms on the full resolution data from the UBB. Additionally, we ran a search for longer bursts with a maximum width of 100 ms with a time down sampling factor of 10. The detected candidates were filtered using the replot_fil command within TransientX using an S/N cutoff of 7 and then inspected manually to identify false positive detections. After discarding false positives, we matched the candidates detected by the long and short searches within each sub-band, i.e. if the same burst was detected in both searches, we kept only the information about the detection with higher S/N. This results in 186 detected bursts in band 1 and band 2 each, 133 bursts in band 3, 32 bursts in band 4, and 10 bursts in band 5. We corrected the arrival times from the individual sub-band detections to infinite frequency and matched any overlapping candidates to avoid counting the same burst multiple times in case it was detected in several sub-bands. This leads to a total number of 459 individual bursts across all sub-bands, whose arrival times are evenly distributed across the observation. We extracted 1 s pulsar archive snippets around the burst arrival times using DSPSR (van Straten & Bailes 2011). Flux and polarization calibration was performed using the pac and fluxcal programs within PSRCHIVE (van Straten et al. 2012) for every sub-band separately. Calibration solutions were derived from observations of 3C 48 on 9 May 2024 using the Perley & Butler (2017) flux scale. To be conservative, we assume a 5% error on the flux scale, which is on the high-end of the suggested error by Perley & Butler (2017). Prior to flux calibration, automatic radio frequency interference (RFI) cleaning was performed on the archive files using clfd (Morello et al. 2019), as well as additional manual flagging using the PSRCHIVE tool pazi. To combine the different sub-bands files from the UBB we loaded the calibrated and RFI-flagged archive files into the PSRCHIVE python framework and combined them as numpy arrays. Our code to combine the different sub-bands of the UBB is available on GitHub3.
For further analysis, we dedispersed all bursts using a common DM value of (527.979 ± 0.085) pc cm−3. This DM value was derived from burst B1, which shows the most complex temporal substructure among the three brightest bursts, using the DM_PHASE package (Seymour et al. 2019). We assume that the DM of FRB 20240114A does not vary significantly within the observation duration, which is valid for other repeating FRBs (e.g., Hessels et al. 2019). In a follow-up study, we will address this question for FRB 20240114A in more detail and study possible DM variations between the 459 detected bursts. The topocentric arrival times of the bursts were corrected to infinite frequency and to the arrival time at the solar system barycenter using get_barycentric_toas within PINT (Luo et al. 2021) and the JPL DE421 ephemeris. We note that the uncertainty of the DM and the exact position of the FRB can introduce an error on the order of several milliseconds.
Appendix B: Astrometric correction for XMM-Newton data
To determine the exact position of FRB 20240114A in the XMM-Newton images, we performed a source detection in the full PN and MOS data of every observation using the edetect_stack task in SAS. While there is no significant source detected in the small-window region of the chips, the outer regions of the MOS-chip still allow for the detection of several field sources. The detected X-ray sources were matched with the Gaia DR3 catalog (Gaia Collaboration 2023) using eposcorr, as described by Kurpas et al. (2024). The resulting astrometric corrections in Right Ascension ΔRA and in declination ΔDec are shown in Table B.1 and were applied to each dataset. The corrections are small compared to the extraction radius. In order to test if they lead to a significant change in our results, we performed all of our analysis also without applying this correction, which indeed has no significant effect on the results since the corrections are small compared to the PSF.
Astrometric corrections for the XMM-Newton pointings calculated with eposcorr.
All Tables
Astrometric corrections for the XMM-Newton pointings calculated with eposcorr.
All Figures
|
Fig. 1. Overview of the observing times (barycentric) and telescopes on May 23, 2024. For XMM-Newton-PN, the displayed time range corresponds to the GTIs. The three vertical lines indicate the arrival times of burst B1, B2, and B3. |
| In the text | |
|
Fig. 2. Waterfall plots of the three brightest bursts from FRB 20240114A that were detected simultaneous to the XMM-Newton observation on May 23, 2024 (left: B1, center: B2, right: B3). RFI-flagged channels are highlighted by the gray lines on the left. The top panel shows the flux density, averaged over the displayed bandwidth, excluding RFI-flagged channels, and the time windows used for the fluence calculation (red lines). The displayed bandwidth for B1 and B3 covers UBB sub-bands 1 and 2, while B2 is shown in UBB sub-bands 3 and 4. The color maps are scaled individually for every burst from minimum to maximum flux density. |
| In the text | |
Current usage metrics show cumulative count of Article Views (full-text article views including HTML views, PDF and ePub downloads, according to the available data) and Abstracts Views on Vision4Press platform.
Data correspond to usage on the plateform after 2015. The current usage metrics is available 48-96 hours after online publication and is updated daily on week days.
Initial download of the metrics may take a while.