Fig. 2.
Download original image
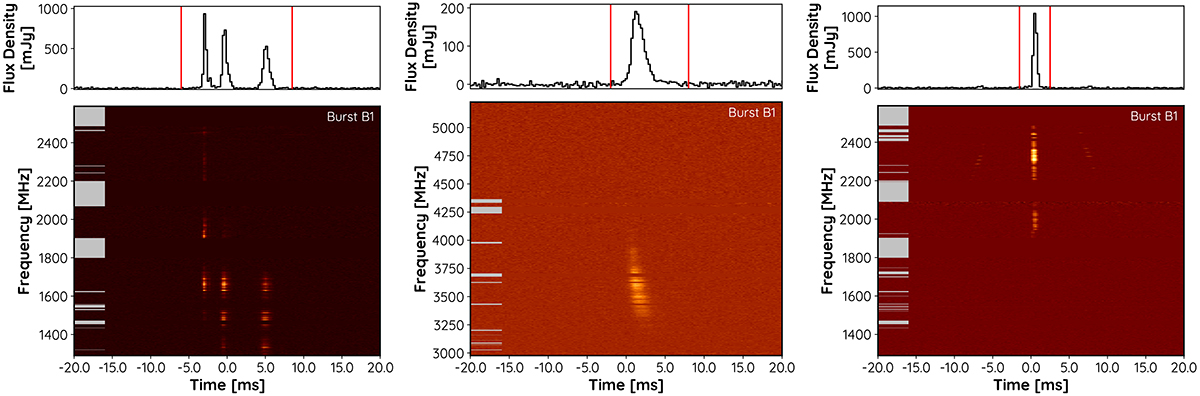
Waterfall plots of the three brightest bursts from FRB 20240114A that were detected simultaneous to the XMM-Newton observation on May 23, 2024 (left: B1, center: B2, right: B3). RFI-flagged channels are highlighted by the gray lines on the left. The top panel shows the flux density, averaged over the displayed bandwidth, excluding RFI-flagged channels, and the time windows used for the fluence calculation (red lines). The displayed bandwidth for B1 and B3 covers UBB sub-bands 1 and 2, while B2 is shown in UBB sub-bands 3 and 4. The color maps are scaled individually for every burst from minimum to maximum flux density.
Current usage metrics show cumulative count of Article Views (full-text article views including HTML views, PDF and ePub downloads, according to the available data) and Abstracts Views on Vision4Press platform.
Data correspond to usage on the plateform after 2015. The current usage metrics is available 48-96 hours after online publication and is updated daily on week days.
Initial download of the metrics may take a while.