| Issue |
A&A
Volume 642, October 2020
|
|
|---|---|---|
| Article Number | A63 | |
| Number of page(s) | 5 | |
| Section | Stellar structure and evolution | |
| DOI | https://doi.org/10.1051/0004-6361/202038656 | |
| Published online | 07 October 2020 | |
CzeV1731: The unique doubly eclipsing quadruple system⋆
1
Astronomical Institute, Charles University, Faculty of Mathematics and Physics, V Holešovičkách 2, 180 00 Praha 8, Czech Republic
e-mail: zasche@sirrah.troja.mff.cuni.cz
2
Variable Star and Exoplanet Section of the Czech Astronomical Society, Vsetínská 941/78, 757 01 Valašské, Meziříčí, Czech Republic
3
Thüringer Landessternwarte Tautenburg, Sternwarte 5, 07778 Tautenburg, Germany
4
Department of Physics, Lehigh University, 16 Memorial Drive East, Bethlehem, PA 18015, USA
5
NASA Goddard Space Flight Center, Greenbelt, MD 20771, USA
6
SETI Institute, 189 Bernardo Ave, Suite 200, Mountain View, CA 94043, USA
7
Astronomical Institute, Academy of Sciences, Fričova 298, 251 65 Ondřejov, Czech Republic
8
Research Centre for Theoretical Physics and Astrophysics, Institute of Physics, Silesian University in Opava, Bezručovo nám. 13, 746 01 Opava, Czech Republic
9
Private Observatory, Pohoří 71, 254 01 Jílové u Prahy, Czech Republic
10
FZU – Institute of Physics of the Czech Academy of Sciences, Na Slovance 1999/2, 182 21 Praha, Czech Republic
11
National and Kapodistrian University of Athens, Department of Physics, Section of Astrophysics, Astronomy and Mechanics, 15784 Zografos, Athens, Greece
12
Vanderbilt University, Department of Physics & Astronomy, 6301 Stevenson Center Ln., Nashville, TN 37235, USA
13
Department of Astronomy, The Ohio State University, 140 West 18th Avenue, Columbus, OH 43210, USA
14
Center for Astrophysics Harvard and Smithsonian, 60 Garden St, Cambridge, MA 02138, USA
15
Department of Astronomy & Astrophysics, The Pennsylvania State University, 525 Davey Lab, University Park, PA 16802, USA
16
Center for Exoplanets and Habitable Worlds, The Pennsylvania State University, 525 Davey Lab, University Park, PA 16802, USA
Received:
15
June
2020
Accepted:
21
July
2020
We report the discovery of the relatively bright (V = 10.5 mag), doubly eclipsing 2+2 quadruple system CzeV1731. This is the third known system of its kind, in which the masses are determined for all four stars and both the inner and outer orbits are characterized. The inner eclipsing binaries are well-detached systems moving on circular orbits: pair A with period PA = 4.10843 d and pair B with PB = 4.67552 d. The inner binaries contain very similar components (q ≈ 1.0), making the whole system a so-called double twin. The stars in pair B have slightly larger luminosities and masses and pair A shows deeper eclipses. All four components are main-sequence stars of F/G spectral type. The mutual orbit of the two pairs around the system barycenter has a period of about 34 yr and an eccentricity of about 0.38. However, further observations are needed to reveal the overall architecture of the whole system, including the mutual inclinations of all orbits. This is a promising target for interferometry to detect the double at about 59 mas and ΔMbol < 1 mag.
Key words: binaries: eclipsing / binaries: spectroscopic / stars: fundamental parameters
The RV and ETV data, and the light curves are only available at the CDS via anonymous ftp to cdsarc.u-strasbg.fr (130.79.128.5) or via http://cdsarc.u-strasbg.fr/viz-bin/cat/J/A+A/642/A63
© ESO 2020
1. Introduction
It has been 12 years since Lee et al. (2008) discovered the first doubly eclipsing system, V994 Her. Until then, there were no stars with two distinctive photometric periods in the data known, apart from systems like BV+BW Dra (Geyer et al. 1982) in which the two pairs can be visually resolved with larger telescopes. Since the discovery of V994 Her, there have been many discoveries of star systems showing two sets of eclipses in their light curves, but only a few have been studied in detail. A comprehensive study of this type of system was introduced by our group in Zasche et al. (2019). The latter work included a list of all currently known doubly eclipsing systems, introduced possible resonances in these 2+2 quadruples, and also discussed the motivation for studying these kinds of objects.
However, only a few of those candidates have been shown to orbit around each other, constituting real 2+2 systems (about 30 such stars out of 146 systems currently known). There are even fewer cases of systems for which the 2+2 quadruple structure is demonstrated and for which the component stellar masses are known based on dynamical analyses from spectra. There are currently only two such stellar systems, in which both the inner and outer orbits are known, V994 Her and V482 Per (Torres et al. 2017). We add a third example in this paper.
2. Discovery and data
The system under investigation in this work is TYC 3929-724-1 ( = 2MASS J19245582+5704084 = TIC 284482112), located at RA = 19h24m55.82s, Dec = +57°04′08.39″, with Vmax = 10.5 mag. Its particular type of variability was discovered by amateur astronomer and co-author Zbyněk Henzl in spring 2019 during observations of another close target in the same field. The system is also known as CzeV1731, which comes from the Czech Variable Stars Catalogue (Skarka et al. 2017), and we use the name CzeV1731 to refer to the system through the rest of this paper. This is a typical situation, in which the discovery itself was originally done by an amateur astronomer and is later confirmed by a professional astronomer. This is a noteworthy example of a scientific contribution of amateur astronomers and also represents the value of exploring archival data and the synthesis of multiple data sets. At this point we would like to emphasize that the Czech Variable Stars catalog1 contains more than 2700 records of new variable stars, mostly discovered by amateur astronomers.
To rule out the possibility that the system is a visual double (two unbound eclipsing binaries at a close projected separation), we checked that the system is not known to be visual binary in the WDS catalog (Mason et al. 2001). We verified the doubly eclipsing nature of the system by compiling existing photometric data. The star was observed by the ground-based, wide-field photometric surveys like “All sky automated survey for supernovae” (ASAS-SN, Shappee et al. 2014; Kochanek et al. 2017), “Super Wide Angle Search for Planets” (SWASP, Pollacco et al. 2006), “Northern Sky Variability Survey” (NSVS, Woźniak et al. 2004), and “Kilodegree Extremely Little Telescope” (KELT, Pepper et al. 2007; Oelkers et al. 2018). These data showed two distinct eclipse periods of about 4.1085 d, and 4.6755 d that show eclipse timing variations (ETVs). We also obtained follow-up light curves from University of Athens Observatory (UOAO) (unfiltered; see Gazeas 2016), Ondřejov Observatory (BVRI), the FRAM telescope (CTA-N FRAM, La Palma, B filter), and also the private observatory of co-author R.U. (unfiltered). Furthermore, Z.H. obtained dedicated VRI Cousins photometry at his private observatory in Veltěže u Loun, Czech Republic, using a 30 cm reflector 305/1200 equipped with Moravian Instruments MII G2-402 CCD camera and processed in a standard way using dark frames and flat fields for reduction. Some of this data was used in the analysis of the system. We provide a list of all photometric data sources used for our analysis in Table 1, which together span over 20 years of observations.
Individual photometric data sets used for our analysis.
We conducted a preliminary analysis of the SWASP, KELT, ASAS-SN, and NSVS photometry assuming a light ratio of the binary pairs of 50%/50%, using a so-called Automatic fitting procedure (AFP method, Zasche et al. 2014). These initial results show that the observed versus predicted times for the two photometric signals are anticorrelated on a timescale of about 26 yr; the ratio of the two ETV amplitudes is about 2.1. This indicates a gravitationally bound, dynamically interacting pair of binaries. See Fig. 1 for this preliminary solution.
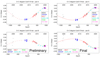 |
Fig. 1. Analysis of period variations of both eclipsing pairs, with individual data sets labeled. The preliminary analysis is on the left-hand side and the final analysis is on the right-hand side of the figure. The filled dots stand for primary eclipses, while the open circles for the secondary eclipses. The larger the symbol, the higher the accuracy. See the text for details about the individual fits. |
In addition to the ground-based photometry, the TESS mission (Ricker et al. 2015) also observed CzeV1731 in Sectors 14,15,16,17,20, and 23 of that mission (TESS Cycle 2). Full frame images (the FFI data) were secured every 30 minutes, which is sufficient for our purpose. For our analysis we used the reduced point spread function flux values. For illustration a segment of 30 min cadence TESS light curve from Sector 20 is plotted in Fig. 2. These TESS data are used in the BJD time frame, while the other ground-based photometry was transformed from Heliocentric Julian Date (HJD) to Barycentric Julian Date (BJD).
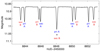 |
Fig. 2. Segment of the TESS photometry of CzeV1731 (30 min cadence data). Eclipses of both pairs are clearly visible, in some cases overlapping. |
We also obtained spectroscopic observations of CzeV1731 for dynamical analysis via radial velocity (RV) measurements. Twelve spectra were taken at Tautenburg Observatory using its two-meter telescope equipped with an echelle spectrograph during September 2019 with an exposure time of 2400 s and a spectral resolving power of 58 000, resulting in a typical signal-to-noise ratio of 80. An example of the two lines Hα, and Hβ obtained out of conjunction are shown in Fig. 3, demonstrating the visible presence of two separate pairs of blended spectra. One more additional spectrum was obtained with the Subaru telescope using the HDS spectrograph. However, despite its superb resolution (R ∼ 160 000) we cannot separate all four components because it was taken at a close phase of both binaries, with so much blending that only the more prominent lines of the B pair were identifiable.
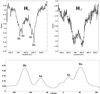 |
Fig. 3. Two portions of the highest-quality spectrum from the Tautenburg observations, showing the Hα (upper left panel) and Hβ (upper right panel) spectral features. When this spectrum was obtained on 15 September 2019, the phases of both binaries were ΦA = 0.088 and ΦB = 0.706. The lower plot shows the cross-correlation function of this spectrum. All four components are distinguishable in Hα, but are hardly detectable in Hβ. |
3. Analysis
We conducted a detailed iterative analysis of the system using only TESS and ground-based VRI photometry via the PHOEBE analysis package, ver. 0.32svn (Prša & Zwitter 2005). The other photometric data were used as a complementary material for the derivation of the minima times for ETV analysis alone. First, the ephemerides were fixed at the values derived from the preliminary analysis mentioned in Sect. 2, effectively removing the ETVs so that each pair of eclipses could be fit with a purely periodic ephemeris. We then iteratively fit each of the inner eclipsing photometric signals after removing the eclipses of the other eclipsing pair. At different time epochs the ephemeris of the pair under analysis is adjusted according to the phase of the A-B orbit based on the initial AFP analysis. This iterative method was substantiated by a fact that the two binaries are rather separate and any dynamical interaction is very weak and slow. For a more compact quadruples, we would need a more sophisticated joint photodynamic approach; see for example the recent study by Rowden et al. (2020).
The values of the third light (i.e., the light contribution of the other pair to the solution of particular pair) are taken as free parameters. We started with an assumption of a 50/50 light ratio of the two pairs, and then refit the third light contribution at each step. For the PHOEBE fitting of the light curves we used the following assumptions: the synchronous rotation of both components (i.e., Fi = 1), the gravity darkening coefficients, albedos kept fixed at their suggested values (gi = 0.32, Ai = 0.5), and limb-darkening coefficients being interpolated from van Hamme’s tables (van Hamme 1993). Differential corrections were used for fitting along with a χ2 minimization. This method is exactly the same as used in our previous work on doubly eclipsing binaries published in Zasche et al. (2019).
Because of the doubly eclipsing quadruple nature of this system, we used several different approaches to analyze the spectroscopic data. These were the classical cross-correlation functions CCF (Tonry & Davis 1979), 2D cross-correlation (Zucker & Mazeh 1994), manual cross-correlation (Škoda 1996), and spectral disentangling (Hadrava 2004). All four components were not detected in all spectra with each of these methods. Our final RVs were then computed as an average of these different values as obtained via different techniques. The code RaveSpan was used for derivation of RVs for some of the spectra (Pilecki et al. 2017).
4. Results
Complete fits of our light curve and RV data are plotted in Fig. 4, while the light curve by Z.H. is plotted in Fig. 5. The luminosity ratio of pair A to pair B is about 45%/55%, as shown in Table 2. Both inner pairs have circular orbits and are well-detached eclipsing systems. Both eclipsing pairs can be denoted as twins because both inner mass ratios are very close to unity. Pair B (i.e., the pair with a slightly longer orbital period) seems to dominate in luminosities and in masses, while its primary component is the brightest and most massive member of the system. All spectral types are late-F to early-G dwarf stars.
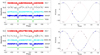 |
Fig. 4. Light curves (left) and RV curves (right) of both pairs A (upper plots) and B (lower). For the RVs, the blue dots and solid line represent the observations and model of the primary pair, while the open circles and the dash-dotted curve represent the secondary components. One spectrum from Subaru was plotted using hexagram symbol. |
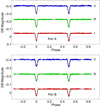 |
Fig. 5. Light curves obtained by Z.H. (Veltěže). |
Parameters from the combined fitting of the photometry and RV of both eclipsing pairs, as well as of their mutual orbit.
Using these results, we tried to model the mutual orbit of the eclipsing pairs around a common barycenter to obtain a self-consistent dynamical analysis of the whole system. All available photometric observations collected (the survey data and our new dedicated observations) were used to construct the O–C diagrams to detect the ETVs. However, we found our solution from the preliminary analysis to be problematic. The amplitudes of both ETVs should be in accordance with the derived masses of both pairs, that is, AA/AB = mB/mA. Even though the O–C analysis finds that the ratio should be about 2.1, the PHOEBE analysis finds the pair masses to be much more similar to each other, yielding AA/AB = mB/mA ≈ 1.2. Hence, we have to modify our model of the mutual orbit and fix this ratio of both ETV amplitudes. Of course whole our ETV analysis was redone with the updated ephemerides and parameters from this latter solution. This final solution is presented in the lower part of Table 2 and is plotted in Fig. 1. As shown, the mutual period is now longer and still only part of it is covered with data. Both of the ETV amplitudes are also larger. But the very first data points of pair A now deviate from the fit more than with the previous solution. This is probably caused by the very poor quality of the NSVS data, both in phase coverage of both minima and its photometric accuracy. Nevertheless, the mass ratio of both pairs is more realistic and we also believe that the whole figure is more self-consistent now. The eccentricity of the orbit is not as high, hence also the periastron passage, which already happened in 2018, did not give us a clear indication of the whole curvature of ETVs. Additional photometric data is expected to result in a more accurate determination of the orbital parameters.
5. Discussion and conclusions
The discovery and analysis of the system CzeV1731 represents a rare configuration of a 2+2 quadruple star system containing two eclipsing binaries, the third system of its kind known to date. The orbital periods of the inner eclipsing pairs are similar, making this system different from the two previously known such systems, V994 Her and V482 Per.
The mutual orbital period of the two pairs of about 33 yr is much longer than both inner binary orbits, hence any mutual dynamical effects (Rappaport et al. 2013) should be very small. Long-term perturbations such as nodal precession of the orbits should be very slow; the typical order of magnitude estimation of such an effect  is long, at ≈90 000 yr.
However, a more interesting possibility for future observations is the calculation of the angular separation of the two pairs on the sky. Owing to its relatively bright nature (V ∼ 10.5), the system may be suitable for interferometry or even direct imaging. Using the Gaia (Gaia Collaboration 2018, 2016) distance of 589 pc, the expected angular separation is about 59 mas. With a small bolometric magnitude difference between the two sources (< 1 mag) we can hope CzeV1731 would soon be resolved. Our solution for the outer orbit is still only partly constrained by data, so further observations would help verify the duration of the outer orbit. The possibility that the outer orbit is longer than that derived by this work is weakly supported by Fig. 6, in which we plotted the two gamma velocities of both inner pairs and their prediction on the wide orbit. From the parameters of the orbits and individual masses we can calculate the value of inclination of the orbit as 53.7 ± 2.5 deg. This value can be used to calculate the predicted systemic velocities and these are plotted in Fig. 6. It seems likely that the orbit is longer and the periastron passage occurs later, but only further observations in the upcoming years would be able to confirm or rule out this hypothesis.
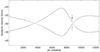 |
Fig. 6. Gamma velocities of both pairs from the RV analysis and the prediction of the systemic velocities on the mutual orbit according to our final solution. |
The Gaia distance itself can also be compared with our estimate of the photometric distance to the system using our inferred values of parameters. The results of our calculations indicated that the system is even slightly closer, about 514 ± 11 pc from the Sun. Such a value would even be better for a prospective interferometric detection because the predicted angular separation would also be a bit larger (67 mas).
Acknowledgments
We would like to thank an anonymous referee for his/her useful suggestions improving the level of the manuscript. The research was supported by the project Progress Q47 Physics of the Charles University in Prague. This work is supported by MEYS (Czech Republic) under the projects MEYS LM2015046, LTT17006 and EU/MEYS CZ.02.1.01/0.0/0.0/16_013/0001403. H.Lehmann acknowledges support by DFG grant LE 1102/3-1. Daniel J. Stevens is supported as an Eberly Research Fellow by the Eberly College of Science at the Pennsylvania State University. The Center for Exoplanets and Habitable Worlds is supported by the Pennsylvania State University, the Eberly College of Science, and the Pennsylvania Space Grant Consortium. We also do thank the SWASP, NSVS, and ASAS-SN teams for making all of the observations easily public available. Part of the data were collected during the photometric monitoring observations with the robotic and remotely controlled observatory at the University of Athens Observatory – UOAO. The observations by Z.H. in Veltěže were obtained with a CCD camera kindly borrowed by the Variable Star and Exoplanet Section of the Czech Astronomical Society. Simon Albrecht, Teruyuki Hirano, and Maria Hjorth are greatly acknowledged for obtaining one SUBARU spectrum. This work has made use of data from the European Space Agency (ESA) mission Gaia (https://www.cosmos.esa.int/gaia), processed by the Gaia Data Processing and Analysis Consortium (DPAC, https://www.cosmos.esa.int/web/gaia/dpac/consortium). Funding for the DPAC has been provided by national institutions, in particular the institutions participating in the Gaia Multilateral Agreement. This research has made use of the SIMBAD and VIZIER databases, operated at CDS, Strasbourg, France and of NASA Astrophysics Data System Bibliographic Services. This paper includes data collected with the TESS mission, obtained from the MAST data archive at the Space Telescope Science Institute (STScI). Funding for the TESS mission is provided by the NASA Explorer Program. STScI is operated by the Association of Universities for Research in Astronomy, Inc., under NASA contract NAS 5-26555.
References
- Gaia Collaboration (Prusti, T., et al.) 2016, A&A, 595, A1 [NASA ADS] [CrossRef] [EDP Sciences] [Google Scholar]
- Gaia Collaboration (Brown, A. G. A., et al.) 2018, A&A, 616, A1 [NASA ADS] [CrossRef] [EDP Sciences] [Google Scholar]
- Gazeas, K. 2016, Rev. Mex. Astron. Astrofis. Conf. Ser., 22 [Google Scholar]
- Geyer, E. H., Hoffmann, M., & Karimie, M. T. 1982, A&AS, 48, 85 [NASA ADS] [Google Scholar]
- Hadrava, P. 2004, PAICz, 92, 15 [Google Scholar]
- Kochanek, C. S., Shappee, B. J., Stanek, K. Z., et al. 2017, PASP, 129, 104502 [Google Scholar]
- Lee, C.-U., Kim, S.-L., Lee, J. W., et al. 2008, MNRAS, 389, 1630 [NASA ADS] [CrossRef] [Google Scholar]
- Mason, B. D., Wycoff, G. L., Hartkopf, W. I., et al. 2001, AJ, 122, 3466 [Google Scholar]
- Oelkers, R. J., Rodriguez, J. E., Stassun, K. G., et al. 2018, AJ, 155, 39 [NASA ADS] [CrossRef] [Google Scholar]
- Pepper, J., Pogge, R. W., DePoy, D. L., et al. 2007, PASP, 119, 923 [NASA ADS] [CrossRef] [Google Scholar]
- Pilecki, B., Gieren, W., Smolec, R., et al. 2017, APJ, 842, 110 [Google Scholar]
- Pollacco, D. L., Skillen, I., Collier Cameron, A., et al. 2006, PASP, 118, 1407 [NASA ADS] [CrossRef] [Google Scholar]
- Prša, A., & Zwitter, T. 2005, ApJ, 628, 426 [NASA ADS] [CrossRef] [Google Scholar]
- Rappaport, S., Deck, K., Levine, A., et al. 2013, APJ, 768, 33 [NASA ADS] [CrossRef] [Google Scholar]
- Ricker, G. R., Winn, J. N., Vanderspek, R., et al. 2015, J. Astron. Telescopes Instr. Syst., 1, 014003 [Google Scholar]
- Rowden, P., Borkovits, T., Jenkins, J. M., et al. 2020, AJ, 160, 76 [CrossRef] [Google Scholar]
- Shappee, B. J., Prieto, J. L., Grupe, D., et al. 2014, ApJ, 788, 48 [NASA ADS] [CrossRef] [Google Scholar]
- Skarka, M., Mašek, M., Brát, L., et al. 2017, OEJV, 185, 1 [NASA ADS] [Google Scholar]
- Stassun, K. G., Oelkers, R. J., Pepper, J., et al. 2018, AJ, 156, 102 [NASA ADS] [CrossRef] [Google Scholar]
- Škoda, P. 1996, Astronomical Data Analysis Software and Systems V, 101, 187 [Google Scholar]
- Tonry, J., & Davis, M. 1979, AJ, 84, 1511 [NASA ADS] [CrossRef] [Google Scholar]
- Torres, G., Sandberg Lacy, C. H., Fekel, F. C., Wolf, M., & Muterspaugh, M. W. 2017, ApJ, 846, 115 [NASA ADS] [CrossRef] [Google Scholar]
- van Hamme, W. 1993, AJ, 106, 2096 [NASA ADS] [CrossRef] [Google Scholar]
- Woźniak, P. R., Vestrand, W. T., Akerlof, C. W., et al. 2004, AJ, 127, 2436 [Google Scholar]
- Zasche, P., Wolf, M., Vraštil, J., et al. 2014, A&A, 572, A71 [NASA ADS] [CrossRef] [EDP Sciences] [Google Scholar]
- Zasche, P., Vokrouhlický, D., Wolf, M., et al. 2019, A&A, 630, A128 [CrossRef] [EDP Sciences] [Google Scholar]
- Zucker, S., & Mazeh, T. 1994, ApJ, 420, 806 [NASA ADS] [CrossRef] [EDP Sciences] [MathSciNet] [Google Scholar]
All Tables
Parameters from the combined fitting of the photometry and RV of both eclipsing pairs, as well as of their mutual orbit.
All Figures
|
Fig. 1. Analysis of period variations of both eclipsing pairs, with individual data sets labeled. The preliminary analysis is on the left-hand side and the final analysis is on the right-hand side of the figure. The filled dots stand for primary eclipses, while the open circles for the secondary eclipses. The larger the symbol, the higher the accuracy. See the text for details about the individual fits. |
| In the text | |
|
Fig. 2. Segment of the TESS photometry of CzeV1731 (30 min cadence data). Eclipses of both pairs are clearly visible, in some cases overlapping. |
| In the text | |
|
Fig. 3. Two portions of the highest-quality spectrum from the Tautenburg observations, showing the Hα (upper left panel) and Hβ (upper right panel) spectral features. When this spectrum was obtained on 15 September 2019, the phases of both binaries were ΦA = 0.088 and ΦB = 0.706. The lower plot shows the cross-correlation function of this spectrum. All four components are distinguishable in Hα, but are hardly detectable in Hβ. |
| In the text | |
|
Fig. 4. Light curves (left) and RV curves (right) of both pairs A (upper plots) and B (lower). For the RVs, the blue dots and solid line represent the observations and model of the primary pair, while the open circles and the dash-dotted curve represent the secondary components. One spectrum from Subaru was plotted using hexagram symbol. |
| In the text | |
|
Fig. 5. Light curves obtained by Z.H. (Veltěže). |
| In the text | |
|
Fig. 6. Gamma velocities of both pairs from the RV analysis and the prediction of the systemic velocities on the mutual orbit according to our final solution. |
| In the text | |
Current usage metrics show cumulative count of Article Views (full-text article views including HTML views, PDF and ePub downloads, according to the available data) and Abstracts Views on Vision4Press platform.
Data correspond to usage on the plateform after 2015. The current usage metrics is available 48-96 hours after online publication and is updated daily on week days.
Initial download of the metrics may take a while.