| Issue |
A&A
Volume 675, July 2023
|
|
|---|---|---|
| Article Number | A113 | |
| Number of page(s) | 10 | |
| Section | Stellar structure and evolution | |
| DOI | https://doi.org/10.1051/0004-6361/202346848 | |
| Published online | 06 July 2023 | |
Detection of seven 2+2 doubly eclipsing quadruple systems
1
Charles University, Faculty of Mathematics and Physics, Astronomical Institute, V Holešovičkách 2, 180 00 Praha 8, Czech Republic
e-mail: This email address is being protected from spambots. You need JavaScript enabled to view it.
2
Hvězdárna Jaroslava Trnky ve Slaném, Nosačická 1713, Slaný 1 274 01, Czech Republic
3
Variable Star and Exoplanet Section, Czech Astronomical Society, Fričova 298, 251 65 Ondřejov, Czech Republic
4
FZU – Institute of Physics of the Czech Academy of Sciences, Na Slovance 1999/2, 182 00 Praha, Czech Republic
5
Astronomical Institute, Academy of Sciences, Fričova 298, 251 65 Ondřejov, Czech Republic
6
Research Centre for Theoretical Physics and Astrophysics, Institute of Physics, Silesian University in Opava, Bezručovo nám. 13, 746 01 Opava, Czech Republic
Received:
9
May
2023
Accepted:
26
May
2023
Abstract
In this work, we study a heterogeneous group of seven stellar systems for the first time. Despite their different distances or spectral types, all of them belong to a very rare group of quadruple systems of 2+2 architecture, where both of the inner pairs harbor eclipsing binaries. These systems are: ASASSN-V J102911.57−522413.6 (inner periods 0.57272, and 3.79027 days), V1037 Her (0.78758 and 5.80348 days), WISE J181904.2+241243 (0.36713 and 0.41942 days), V2894 Cyg (2.57434 and 1.30579 days), NSVS 5725040 (1.79368 and 0.76794 days), WISE J210230.8+610816 (1.84324 and 0.57159 days), and ZTF J220518.78+592642.1 (2.79572 and 3.34615 days). Their outer mutual periods are: 9.3, 25.4, 18.7, 27.5, 2.6, 2.2, and 14.0 yr, respectively. These outer periodicities were derived using longer time span of photometric observations of these systems and analysing their period changes of both inner pairs via ETVs (eclipse-timing variations). Most of these studied systems are detached, as evidenced by the proper modelling of their light curves. A few of them show significant eccentric orbits with apsidal motion (e.g., V2894 Cyg, and NSVS 5725040). Further spectroscopic follow-up observations would offer a better characterization of the component star’s parameters (for e.g., NSVS 5725040), as well as a potential interferometric detection of the systems as real doubles on their mutual orbits (for e.g., V1037 Her). A rather interesting excess of systems close to a 3:2 mean motion resonance is seen only for early spectral-type stars with higher temperatures.
Key words: binaries: eclipsing / stars: fundamental parameters
© The Authors 2023
 Open Access article, published by EDP Sciences, under the terms of the Creative Commons Attribution License (https://creativecommons.org/licenses/by/4.0), which permits unrestricted use, distribution, and reproduction in any medium, provided the original work is properly cited.
This article is published in open access under the Subscribe to Open model. This email address is being protected from spambots. You need JavaScript enabled to view it. to support open access publication.
1. Introduction
Many important findings derived from classical studies of eclipsing binaries (hereafter EBs) are still relevant today. Despite the fact that these methods are about a century old, EBs still represent useful tool for deriving many astrophysical parameters for stars and their orbits and for studies of stellar populations, their formation mechanisms, stellar structures, evolution, and so on (see e.g., Southworth 2012, or Tokovinin 2021).
The study of quadruples comprising of two eclipsing binaries with 2+2 architecture is still a quite novel topic, since the first so-called doubly eclipsing system (V994 Her) was discovered by Lee et al. (2008). Having two distinct sources of eclipses, which can, in principle, be modelled independently, there are many more constraints that should be taken into account. Thus, independent analyses should lead to the same findings for distance, same age, same metallicity, and so on. To prove its quadruple nature, we would have to confirm that both of them actually orbit around a common barycenter via spectroscopy, interferometry, or eclipse-timing variation (ETV) analysis signals of both inner eclipsing binaries. We chose the last method one for the study presented here, given its long-term collection of photometric data that spans many years – up to a few decades.
The group of doubly eclipsing systems showing two periods has expanded in recent years, now counting more than 350 stellar systems. However, detailed analyses that have definitively proved their architecture as a 2+2 quadruple are still relatively rare. These have mostly been systems on very short mutual orbits that show usually large dynamical interactions, published by group of authors associated with (Borkovits et al. 2021, 2018; Kostov et al. 2021). These studies even include the discovery of a sextuple system of three eclipsing binaries (Powell et al. 2021). In addition, there were have also been discoveries made by our group, focusing mainly on systems with longer mutual orbital periods, carried out on the basis of archival photometry and our own data (see, e.g., Zasche et al. 2019, 2020, 2022a). The topic of close, dynamically interacting multiples was comprehensively summarized in a recent review by Borkovits (2022).
2. The selected systems
Our process for choosing these specific systems was relatively straightforward. We tried to scan many potential doubly eclipsing systems and attempted to identify the ones that obviously exhibit some variations of period for both inner eclipsing pairs. Such variations in their eclipse times have to be adequately covered for both A and B pairs, and have to be in opposition to each other for A and B, respectively. This usually means that such a multiple system should also have both of its eclipsing periods adequately observed in a range of older, ground-based data from different databases to also be able detect the eclipses of both pairs and to derive the eclipse times as well. For some of the systems, this was quite problematic, especially as the data suffer from large uncertainties. We note that at least some indication of a movement of both pairs around a common barycenter was detected. The necessity of all these systems being also visible in the older, ground-based data led to slightly brighter systems (10–15 mag), which are located in both the southern and northern hemispheres.
The selected systems were chosen from our recent publication of new candidates of doubly eclipsing stars showing two sets of eclipses (Zasche et al. 2022b), along with one system from publication by Eisner et al. (2021). Two others from our sample are presented here for the first time as doubly eclipsing quadruples, namely, WISE J181904.2+241243, and NSVS 5725040. We refer to Table 1 for the summary of basic information about these stars, their various catalogue naming, and positions on the sky.
Basic information about the systems.
3. Photometric data used for the analysis
The photometric data used in the current study can be divided into two parts. At first, these are the super-precise data from Transiting Exoplanet Survey Satellite (TESS, Ricker et al. 2015). These data were used for the light curve modelling of both inner eclipsing binaries to derive their basic properties, such as relative radii, inclinations, and fractional luminosities. These data were extracted from the TESS archive using the lightkurve tool (Lightkurve Collaboration 2018). Typically, several TESS sectors of data are available for each of the stars.
In addition, we also used older, ground-based archival photometry for certain stars. These data are very useful for us when trying to trace the period variations of both pairs via the ETV method. Much more scattered photometry than the TESS data provide us with a very useful source of data thanks to their time spans, which often go back several decades. Without these data, it would be very difficult to prove the ETV and definitively confirm the mutual movement of both binaries only using the TESS archive.
In addition, several dozens of nights of observation for these targets were also carried out for the purposes of this study. These heterogeneous data were secured at several observatories: 1. Ondřejov observatory in Czech Republic, using a 65-cm telescope and G2-MII CCD camera equipped with standard V and R photometric filters; 2. Danish 1.54-m telescope on La Silla in Chile, remotely controlled, using the R and I filters; 3. FRAM 25-cm telescope located on La Palma (Observatorio del Roquede de los Muchachos, see Prouza et al. 2019); 4. FRAM 30-cm telescope located in Argentina (part of the Pierre Auger observatory, see Aab et al. 2021); 5. Three different private observatories in Czech Republic, using smaller telescopes, with observers from the team of co-authors: M. Mašek, R. Uhlař, and Z. Henzl.
For the reduction of all these data, standard procedures using dark frames and flat fields were used, and the photometry was derived using standard aperture-photometry tools. All of these photometric data points were only used for calculating precise times of eclipses for tracing the ETVs with a higher degree of conclusiveness. All of these dedicated observations of the stars are plotted as red symbols in the figures included throughout this paper.
4. Analysis
For the light-curve (hereafter LC) modelling, we used the well-known programme PHOEBE (Prša & Zwitter 2005), which is originally based on the Wilson–Devinney algorithm (Wilson & Devinney 1971). However, having no radial velocities for our object, several simplifying assumptions had to be made prior to fitting the individual LCs. For example, the issue of the mass ratio and its derivation solely from the photometry can usually be problematic for the detached binaries, as has been previously stated elsewhere in the literature (see e.g., Terrell & Wilson 2005). For this reason, we usually fixed its value to 1.0 for most of our detached binary systems. In addition, the synchronicity parameters were kept fixed at 1.0, while the albedo and gravity brightening coefficients were also kept fixed at their suggested values, according to the temperature.
The input temperature values for the primary components were taken from the latest Gaia DR3 catalogue (Gaia Collaboration 2016, 2023), using the values from the GSP-Phot pipeline. These values are summarised in Table 2.
Derived parameters for the two inner binaries A and B.
We proceeded mostly step-by-step according to the following scheme. At first, using all photometric data from the TESS satellite, we identified the more pronounced eclipsing pair (named pair A), built its phased light curve, and attempted to carry out a preliminary fitting of this LC shape. After subtracting this LC, we obtained a preliminary photometry for only pair B. Doing the preliminary analysis also for this pair B, we returned to the complete photometry to re-analyse the LC of pair A with the residual data. Afterwards, we returned to pair B again and made a better fit to B. This iterative approach was repeated several times. When subtracting both A and B light curves, the complete residuals should not show any evident phase-dependent variations. This is our proof that the LC shapes are satisfactory.
However, as a second step, we needed to derive the individual times of eclipses (using our AFP method, as described in Zasche et al. 2014). This method is using the light curves from various databases or surveys, but phased with linear ephemerides over a longer time interval. This has to be done due to the availability of only sparse photometry and combining the data over more epochs makes the phased light curve adequately covered for the method. We usually used the time interval of one year, but this can be arbitrarily changed with respect to the number of data points in each interval. With such an approach, we derived a more suitable orbital period than the one originally assumed. With the new period, the whole analysis and the LC modelling process should be repeated again, and then iteratively several more times.
At first, we started with the simplest assumption, namely, that both A and B binaries contribute the same to the total light curve (i.e., using a third light, L3 = 50%); thus, this parameter could also be kept free for fitting. The sum of both luminosities for both pairs, LA + LB, should give 1.00 (or 100%) but, in reality, the total luminosity is usually over 1.0, simply due to the additional light from nearby sources caused by large TESS pixels.
5. Results
In this section, we focus on the individual systems presented in our analysis in greater detail.
5.1. ASASSN-V J102911.57−522413.6
The first star in our study, ASASSN-V J102911.57−522413.6, is located in the constellation of Velorum. This star was discovered as a variable one using the photometric data from the ASAS-SN survey (Shappee et al. 2014; Kochanek et al. 2017). However, these authors only detected the shorter and more pronounced period of 0.573 days from their data. Additionally, the star was later classified as doubly eclipsing in our recent study (Zasche et al. 2022b), with another periodicity of about 3.79 days found in the data. Both of the binaries show EA-type light curve, indicating detached orbits. This is more evident for pair B, which is obviously eccentric having the secondary eclipse located at the 0.58 phase from the primary one. No other detailed study of the star has been published since then; also, its spectroscopic analysis is missing. The only available Gaia spectrum (Gaia Collaboration 2023) is of poor quality, mainly due to its low brightness (as a 13th magnitude star).
We chose the best available light curve for the system, namely, the TESS one from sector 37. These data were analysed in PHOEBE, resulting in the parameters given in Table 2, and the fits of the LC for both A and B pairs are given in Fig. 1. As we can see, there is an asymmetry of the LC of pair A, showing that near the quadratures of the orbit, the LC has different brightness levels. Such a behavior is usually explained by a presence of surface spots. We have not tried to fit them, we only wish to point out this peculiar aspect of the system. Due to the significant out-of-eclipse variations, the mass ratio was also fitted as free parameter for pair A, while for the very detached system B, this was kept fixed during the fitting process. We found quite a significant eccentricity for pair B, namely, about e = 0.127.
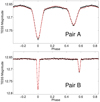 |
Fig. 1. Light-curve fits of ASASSN-V J102911.57−522413.6 for both eclipsing pairs based on the PHOEBE fit and TESS data. |
For studying the long-term evolution of the orbital periods for both pairs we collected the available photometric data for the system spanning several years into the past (mainly the ASAS-SN survey). However, some of the data do not show any photometric variation at all (e.g., ASAS or old digitalized photographic plates via the DASCH project), due to their scatter and overly low amplitude in the photometric variations of both pairs. These data were complemented with our new dedicated observations of the system from two observing sites. At first, we observed the star on La Silla using the Danish 1.54-m telescope equipped with a CCD camera and using standard R filter. Secondly, on several other nights, the target was also observed using the 30-cm FRAM telescope located in Argentina at the Pierre Auger Observatory. We used these data only for deriving the times of eclipses for detecting the ETV in both pairs. The result of this fitting is plotted in Fig. 2. However, our current data are still too limited and cover only part of the orbit. Hence, we decided to use only a more simple description of the orbit using a zero eccentricity. Therefore, we needed to expand the time base of our data and/or obtain new observations of a much better quality. Only then would it be possible to derive its correct eccentricity as well. The fitting has led to period of about nine years. We also find that the amplitude of ETV for pair B is slightly higher than that of pair A. This result is in good agreement with our LC modelling, showing that the more dominant in luminosity is the pair A, indicating its higher mass as well.
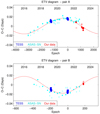 |
Fig. 2. ETV diagram of ASASSN-V J102911.57−522413.6 showing two sets of eclipses of A and B pairs as resulting from our analysis. The theoretical curve representing the fit given in Table 3 is plotted as a red solid curve, while the dots stand for primary eclipses and the open circles for secondary ones. The color denotes the different source of data with the legend in the lower part of the plot. |
Using the parallax of the system given by Gaia Collaboration (2023) of 0.711 mas (i.e., a distance of about 1400 pc) the predicted angular separation of the two binaries should be about 10 mas. Unfortunately, with such a small angular distance, we cannot hope to resolve the double – even with speckle interferometry technique, it is not possible due to the low brightness of the star. Thus, only new upcoming observations in the next few years will be able to more definitively prove our hypothesis and derive the eccentricity of the orbit as well.
5.2. V1037 Her
The second star included into our set is V1037 Her, which was discovered to be a variable star by Akerlof et al. (2000), but who reported an incorrect period for it. It was later found that the dominant variation shows a periodicity of 0.78758 days, and showing a significant light curve of a detached eclipsing type with deep eclipses of about 0.3 mag. Over the last two decades, the star was observed several times by amateur astronomers, who derived a few precise times of eclipses of this binary. Quite surprisingly, nobody noticed that there is also an additional variation with a period of about 5.8 days, also showing rather deep eclipse of more than 0.1 mag (despite the fact that the eclipse is clearly visible on older photometric data from various surveys as well; see more details below).
As in the previous case, for the LC modelling, we used TESS data. In Fig. 3, our final fit of both LCs is shown, based on TESS satellite data. As we can see, the secondary eclipses of pair B are only shallow, but clearly detectable in the TESS data. On the other hand, pair A shows significant asymmetry, which is attributed to stellar spots. We used the hypothesis of one spot located on the primary component, which is cooler than the surrounding areas of the surface. Thus, we were able to describe the asymmetry relatively well. Its parameters, as derived from sector 52, are as follows: spot latitude – 0.96 rad, longitude – 5.04 rad, radius – 0.16 rad, and temperature ratio – 0.66. However, when we compare these parameters with those of sector 25, we find that such a spot cannot describe properly the LC and the asymmetry is different. Hence, an evolution of spot parameters has to be taken into account when properly modelling the system. Both pairs are circular, but pair B has much more distant components, while pair A has the components much closer to each other, also showing a non-negligible ellipsoidal variation. Pair A is also the dominant pair in the system concerning its luminosity level. The final LC parameters are given in Table 2.
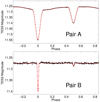 |
Fig. 3. Light-curve fits of V1037 Her for both A and B eclipsing pairs. |
Besides the TESS photometry there were also many data points collected from various older photometric databases and surveys, where both eclipsing periods are detectable as well. These are mainly: the ASAS-SN survey, SuperWASP survey (Pollacco et al. 2006), and the ATLAS survey (Heinze et al. 2018). Apart from these publicly available data, we also observed the star over several nights with our own means. Our data were obtained in three different observatories: the first is the private observatory of R.U. in Jílové u Prahy, CZ, using small 34-mm and 150-mm aperture telescopes and a standard R filter; the second was carried out by M.M., using the FRAM telescope of 25-cm diameter located in La Palma and using a standard R filter; finally, the third is the private observatory of Z.H. in Veltěže u Loun, CZ. All these data were then used in Fig. 4, where we can see the period variations of both A and B pairs on their mutual orbit. Despite a quite longer period of about 26 years, which is still not adequately covered by the data, we can confidently state that the system is bound and both pairs orbit around each other. High eccentricity causes the rapid period variation that is clearly visible near the periastron. From our orbital parameters and the distance to the system from Gaia (d = 374 pc), we can compute the predicted angular separation of the two doubles on the sky. This resulted in about 65 mas, which is much more favourable than for the previous case; however, this is still at the edge of possible detection for such a star (i.e., of about 12 mag).
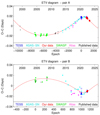 |
Fig. 4. ETV diagram of both pairs of V1037 Her. |
5.3. WISE J181904.2+241243
The next system studied here is WISE J181904.2+241243, which was found to be an eclipsing binary candidate by the ATLAS survey (Heinze et al. 2018). It shows a rather contact dominant pair A, with a periodicity of about 0.367 days and about 0.3 mag deep eclipses; in addition, there is also a weaker variation for pair B, which shows a slightly more detached configuration with period of about 0.419 days. The star was not detected as doubly eclipsing before and this is the first publication showing its true nature. WISE J181904.2+241243 definitely exhibits the most contact configuration (of both pairs) among the studied systems.
For the LC modelling, we used the TESS data from sector 40, where both eclipsing pairs are clearly visible. The pair A resulted in a contact configuration of a W UMa-type light curve. We also tried to fit the mass ratio of this pair, since the ellipsoidal variations are large. The fraction of luminosities indicates that the dominant is the pair A. However, pair B shows a slight asymmetry of its light curve, which is moreover changing in between different sectors of data making the whole analysis of its period changes more challenging. The results of the LC fitting are given in Fig. 5, while its parameters are given in Table 2.
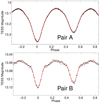 |
Fig. 5. Light-curve fits of WISE J181904.2+241243 for both A and B eclipsing pairs. |
Concerning its period changes, we primarily used the TESS photometry for deriving the eclipse times of both pairs. In addition, other databases such as ATLAS, ASAS-SN, and SuperWASP were used. In particular, for pair A, these also provide us with quite precise estimates of times of eclipses; however, for pair B, due to its shallow eclipses, only more scattered datapoints were derived. Figure 6 displays the result of the combined ETV fitting of both pairs, while its parameters are given in Table 3. As we can see, pair B resulted in lower amplitude of ETV, indicating a higher mass than that of pair A. This is in contradiction to the resulting luminosity ratios from the LC analysis. We have no clear explanation for such a discrepancy. The most recent observations of both pairs should indicate some deviation from our predicted light-time effect fit, so there is still a possibility that the overall orbit is different than our presented solution. However, with the available data points, we were not able to find a more suitable solution (even using the quadratic ephemerides). Further observations in the future should resolve this question.
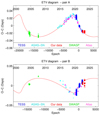 |
Fig. 6. ETV diagram of both pairs of WISE J181904.2+241243. |
Results of the combined ETV analysis.
5.4. V2894 Cyg
Another system considered in our study is V2894 Cyg, which is the brightest star in our sample. For this reason, it was also classified as a B5 star by Annear (1953). There was sometimes a problematic identification of the star with a close-by star HD 227245, which has a similar brightness. However, we believe that the B5 spectral type belongs to our target. The star was first detected as doubly eclipsing by Eisner et al. (2021), who gave its both eclipsing periods of 1.306 and 2.575 days. The star is also probably a member of the open galactic cluster named [FSR2007] 0198 (Cantat-Gaudin & Anders 2020).
We studied the star mainly using the TESS data. The LCs of both pairs were analysed resulting in the following picture. Pair A shows evident asymmetries, likely caused by some photospheric spots. And moreover, the pair is also eccentric and showing significant apsidal motion. Such a movement of apsides is visible even during the duration of the TESS data. Hence, this effect has to be taken into account for a proper analysis. The results from our LC fitting are given in Table 2, while the final plots are shown in Fig. 7.
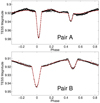 |
Fig. 7. Light-curve fits of V2894 Cyg for both A and B eclipsing pairs. |
Due to an insufficient amount of data, we only applied a simplified approach of the circular outer orbit, which is given in a plot in Fig. 8 and resulting parameters are given in Table 3. From the long-term variation of times of eclipses there resulted that the apsidal motion has the period of about 46 years and the eccentricity of the orbit is 0.155. Such a value is in great agreement with the 0.161 as resulted from the LC fitting. The plot shown in Fig. 8 for pair A is plotted after subtraction of the long term apsidal motion, only showing the contribution of the mutual orbit around a common barycenter. Mutual movement shows that the orbit is relatively long, with a period of more than 27 years; hence, only part of it is covered by the observations. New data in the coming years are therefore needed for a better derivation of its orbital parameters.
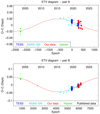 |
Fig. 8. ETV diagram of both pairs of V2894 Cyg. |
5.5. NSVS 5725040
The next stellar system we studied is NSVS 5725040, which has not previously been mentioned as a doubly eclipsing system before; hence, it can be considered as a novel discovery. It is also the second brightest star in our sample and due to its brightness, it also has a spectrum taken by the LAMOST survey (Luo et al. 2015), which shows obviously the two-component feature. It was also being classified as a B1V star based on (Liu et al. 2019). But no other more detailed information about this system is available.
Using the TESS photometry we arrived at the following picture. At first, the more dominant pair A shows an evidently eccentric orbit and also the fast apsidal motion. With an eccentricity of about 0.14 and orbital period of 1.79 days, it is among the systems with the highest eccentricity with respect to stars with periods shorter than 2 days. The much shallower pair B has an orbital period that is even shorter than pair A, but showing a circular orbit. All of the LC parameters are given in Table 2, while the shape of the LC fit can be seen in our Fig. 9. It is obvious that pair A is very dominant in the luminosity levels, which also causes pair B to only have such a low photometric amplitude of its eclipses, at the level of only 0.01 mag.
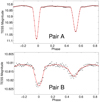 |
Fig. 9. Light-curve fits of NSVS 5725040 for both A and B eclipsing pairs. |
Concerning the period changes and the ETV analysis, it was found quite problematic to analyze it properly due to the very shallow eclipses of pair B, as this pair is almost undetectable in other photometric data beyond TESS. There is also some older data going back to the beginning of the 20th century, but these are almost useless for our whole analysis. However, the period changes of both pairs are pretty visible only using the TESS data due to the short period of the mutual A–B orbit. The result of this analysis was that the eccentric orbit of pair A shows significant apsidal motion with period of about 23.9 years only, which makes it one of the fastest apsidal motion systems detected so far. Besides, the eccentricity of orbit A resulted in 0.140, in perfect agreement with the eccentricity derived from the LC fitting (resulted in 0.141). The final fitting of available data is shown in Fig. 10. One remarkable consequence of our result is the finding that the ratio of periods  resulted in about 1400 years. This ratio shows us the level of these dynamical long-period interactions of the two inner and outer orbits. For example, the period of nodal precession (if any, only in case of non-coplanar systems) should be on the order of the same duration, that is, we should expect some variations of inclination of pair A over a century of precise observations.
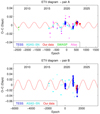 |
Fig. 10. ETV diagram of both pairs of NSVS 5725040. |
5.6. WISE J210230.8+610816
The star WISE J210230.8+610816 was detected as a doubly eclipsing system in our recent study (Zasche et al. 2022b). The dominant pair A has the period of about 1.84 days and the amplitude of about 0.2 mag, showing obviously the light curve of detached configuration; while the shallower pair B has the amplitude of about 0.06 mag only and with its period of about 0.57 days shows a contact binary type light curve. It is the faintest star in our sample and, thus, no other detailed study of the star has been published yet. Also, the spectrum of the star is not available (besides the relatively poor Gaia spectrum).
We used mainly the TESS photometry to derive its basic physical and orbital properties. The star was observed in six sectors and both sets of eclipses are clearly visible there. In our Fig. 11, we give the final fits of both pairs as the result of the PHOEBE program. Its parameters are given in Table 2, where one can clearly see that the pair A is the dominant one. For this reason, the variations of pair B are quite problematic to detect in other photometric databases and surveys. Pair B seems to be almost in contact, while pair A is a detached one.
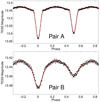 |
Fig. 11. Light-curve fits of WISE J210230.8+610816 for both A and B eclipsing pairs. |
The study of period variation of both eclipsing pairs resulted in the following (see Fig. 12). The mutual orbit is eccentric, having a period of only about 2.2 years, making it the fastest quadruple in our sample. Amplitude of the pair B seems to be about 2 times larger, hence, also its mass should be half that one of the pair A. Our result is in very good agreement with an independent finding by Czavalinga et al. (2023), who analysed the Gaia and TESS data, giving the outer period value of 843.88 ± 22.78 days. However, their study has not taken into account its quadruple nature, since they did not detect the eclipses of the pair B in their data. Moreover, our finding is supported with much larger dataset spanning a longer time interval than that used in Czavalinga et al. (2023) Surprisingly, the ratio of periods here,  , resulted in even lower value than for the previous system, namely, of only about 980 years. Hence, we can hope detecting some inclination changes during the upcoming decades, in the case of non-coplanar orbits.
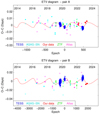 |
Fig. 12. ETV diagram of both pairs of WISE J210230.8+610816. |
5.7. ZTF J220518.78+592642.1
The last system in our compilation is ZTF J220518.78+592642.1, which was first detected as a doubly eclipsing system independently by Zasche et al. (2022b) and Kostov et al. (2022). The very dominant pair A has about a 2.8 d period and deep eclipses of about 0.2 mag, while pair B is only of about 0.03 mag deep and having an approximately 3.3-d orbital period. Besides the one Gaia spectrum, clearly showing a double-line profile, there are no other spectra available for this star. With its inferred distance of about 7 kpc, this is the most distant object among our stars.
Analysing its TESS light curves, we obtained the following results (also shown in Table 2, where are the parameters of the fit). Both the light curves are shown in Fig. 13. As we can see, we deal with very dominating pair A (concerning its luminosity), while pair B contributes only a few percent. Moreover, from the shape of the LC of pair B, we see that it contains two rather different components (their temperatures). The pair A also shows a minimal asymmetry of its LC at quadratures.
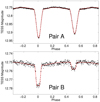 |
Fig. 13. Light-curve fits of ZTF J220518.78+592642.1 for both A and B eclipsing pairs. |
Collecting all available older measurements of the star, we carried out the long-term period variation analysis. To detect pair B is problematic due to its shallow eclipses. However, our data clearly shows the period variations and both the ETVs behaving in the opposite manner. The final parameters are given in Table 3, while the fit is plotted in Fig. 14. We find that pair B has higher amplitude for its ETV, but lower than we would generally expect from the luminosity ratio as derived from the LC fitting. We leave this as a open question, since the coverage of the ETV variation for pair B is still very poor and the amplitude would also be much larger than our current fit shows.
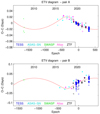 |
Fig. 14. ETV diagram of both pairs of ZTF J220518.78+592642.1. |
6. Discussion and conclusions
We performed the first detailed analysis of seven new multiple systems that have been proven to be bound quadruples of 2+2 architecture. We were able to detect the period variations of both pairs of these systems thanks to the collection of photometric observations spanning back several decades. Despite the fact that their outer mutual periods are sometimes too long, meaning that our data are still insufficient to fully describe the orbit, our analysis definitively shows the ETV variations of both A and B pairs behaving in the opposite manner.
Besides the ETVs of both pairs, we also detected the significant apsidal motions in several binaries as a byproduct. All of these fits are shown in Fig. 15, where we plotted only the apsidal motion fits following the subtraction of the mutual movement of the individual pairs around their barycenters.
 |
Fig. 15. Apsidal motion fits of four eccentric orbits: ASASSN-V J102911.57−522413.6: pair B, V2894Cyg: pair A, NSVS 5725040: pair A, and ZTF J220518.78+592642.1: pair A. For all the plots, these diagrams were obtained after subtraction of the ETVs of individual pairs only showing the long-term apsidal motions. Black dots represent the primary eclipses, blue ones are secondaries. |
At present, the total number of doubly eclipsing systems showing definitely two sets of eclipses is more than 350 (but still only a small fraction of them have been proven to be real bound 2+2 quadruples). As in our previous studies, we plotted the period ratios of all these systems. We completed the known doubly eclipsing systems with other 2+2 quadruples from the literature and from the MSC catalog (Tokovinin 2018). This can be seen at the upper part of the Fig. 16, where the new systems from the present study are shown alongside other candidates (with two eclipsing periods) that are still unpublished (awaiting publication in the near future). The number of systems in our sample has reached 450 in total. However, unlike our previous studies, we also divided the set into two subgroups. At first, the systems of earlier spectral type, having mostly radiative atmospheres, with Teff > 7000 K, and/or having a Gaia photometric index of (Bp − Rp) < 0.45. Also, on the contrary, the systems having convective atmospheres of later spectral types, with Teff < 7000 K. These two subplots are also shown in the lower plots. Surprisingly, the suspicious peak near the 3:2 mean motion resonance is preferably seen only in the one showing hotter stars with Teff > 7000 K. The question of whether this indicates some deeper physical reason or it is just a coincidence resulting from the small number statistics remains open. Finally, we recommend that new systems should be added to extend the statistics and sample in both these groups.
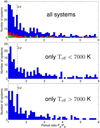 |
Fig. 16. Statistics of the period ratios of both inner pairs. Upper plot: blue columns showing all 2+2 quadruples, green data showing the other non-eclipsing 2+2 systems from the MSC catalogue, red data are the unconfirmed systems detected but still not published yet, and, finally, the magenta data are our new seven systems presented in the current paper. Middle plot: only the systems with temperatures below 7000 K. Bottom plot: only the early-type systems with Teff > 7000 K. |
Acknowledgments
We do thank the ASAS, SuperWASP, ZTF, ASAS-SN, and TESS teams for making all of the observations easily public available. The research of P.Z. was supported by the project Progress Q47 Physics of the Charles University in Prague. We are also grateful to the ESO team at the La Silla Observatory for their help in maintaining and operating the Danish telescope. This work has made use of data from the European Space Agency (ESA) mission Gaia (https://www.cosmos.esa.int/gaia), processed by the Gaia Data Processing and Analysis Consortium (DPAC, https://www.cosmos.esa.int/web/gaia/dpac/consortium). Funding for the DPAC has been provided by national institutions, in particular the institutions participating in the Gaia Multilateral Agreement. We would also like to thank the Pierre Auger Collaboration for the use of its facilities. The operation of the robotic telescope FRAM is supported by the grant of the Ministry of Education of the Czech Republic LM2023032. The data calibration and analysis related to the FRAM telescope is supported by the Ministry of Education of the Czech Republic MSMT-CR LTT18004, MSMT/EU funds CZ.02.1.01/0.0/0.0/16_013/0001402 and CZ.02.1.01/0.0/0.0/18_046/0016010. This work is supported by MEYS (Czech Republic) under the projects MEYS LM2023047, LTT17006 and EU/MEYS CZ.02.1.01/0.0/0.0/16_013/0001403 and CZ.02.1.01/0.0/0.0/18_046/0016007. The research of P.Z., J.K., and J.M. was also supported by the project COOPERATIO - PHYSICS of Charles University in Prague. The observations by Z.H. in Veltěže were obtained with a CCD camera kindly borrowed by the Variable Star and Exoplanet Section of the Czech Astronomical Society. This research made use of Lightkurve, a Python package for TESS data analysis (Lightkurve Collaboration 2018). This research has made use of the SIMBAD and VIZIER databases, operated at CDS, Strasbourg, France and of NASA Astrophysics Data System Bibliographic Services.
References
- Aab, A., Abreu, P., Aglietta, M., et al. 2021, J. Instrum., 16, P06027 [Google Scholar]
- Akerlof, C., Amrose, S., Balsano, R., et al. 2000, AJ, 119, 1901 [NASA ADS] [CrossRef] [Google Scholar]
- Annear, P. R. 1953, ApJ, 118, 77 [NASA ADS] [CrossRef] [Google Scholar]
- Borkovits, T. 2022, Galaxies, 10, 9 [NASA ADS] [CrossRef] [Google Scholar]
- Borkovits, T., Albrecht, S., Rappaport, S., et al. 2018, MNRAS, 478, 5135 [NASA ADS] [Google Scholar]
- Borkovits, T., Rappaport, S. A., Maxted, P. F. L., et al. 2021, MNRAS, 503, 3759 [NASA ADS] [CrossRef] [Google Scholar]
- Cantat-Gaudin, T., & Anders, F. 2020, A&A, 633, A99 [NASA ADS] [CrossRef] [EDP Sciences] [Google Scholar]
- Czavalinga, D. R., Mitnyan, T., Rappaport, S. A., et al. 2023, A&A, 670, A75 [NASA ADS] [CrossRef] [EDP Sciences] [Google Scholar]
- Eisner, N. L., Barragán, O., Lintott, C., et al. 2021, MNRAS, 501, 4669 [NASA ADS] [CrossRef] [Google Scholar]
- Gaia Collaboration (Prusti, T., et al.) 2016, A&A, 595, A1 [NASA ADS] [CrossRef] [EDP Sciences] [Google Scholar]
- Gaia Collaboration (Vallenari, A., et al.) 2023, A&A, 674, A1 [NASA ADS] [CrossRef] [EDP Sciences] [Google Scholar]
- Heinze, A. N., Tonry, J. L., Denneau, L., et al. 2018, AJ, 156, 241 [Google Scholar]
- Kochanek, C. S., Shappee, B. J., Stanek, K. Z., et al. 2017, PASP, 129, 104502 [Google Scholar]
- Kostov, V. B., Powell, B. P., Torres, G., et al. 2021, ApJ, 917, 93 [NASA ADS] [CrossRef] [Google Scholar]
- Kostov, V. B., Powell, B. P., Rappaport, S. A., et al. 2022, ApJS, 259, 66 [CrossRef] [Google Scholar]
- Lasker, B. M., Lattanzi, M. G., McLean, B. J., et al. 2008, AJ, 136, 735 [Google Scholar]
- Lee, C.-U., Kim, S.-L., Lee, J. W., et al. 2008, MNRAS, 389, 1630 [NASA ADS] [CrossRef] [Google Scholar]
- Lightkurve Collaboration (Cardoso, J. V. D. M., et al.) 2018, Astrophysics Source Code Library [record ascl:1812.013] [Google Scholar]
- Liu, Z., Cui, W., Liu, C., et al. 2019, ApJS, 241, 32 [CrossRef] [Google Scholar]
- Luo, A.-L., Zhao, Y.-H., Zhao, G., et al. 2015, RAA, 15, 1095 [NASA ADS] [Google Scholar]
- Pollacco, D. L., Skillen, I., Collier Cameron, A., et al. 2006, PASP, 118, 1407 [NASA ADS] [CrossRef] [Google Scholar]
- Powell, B. P., Kostov, V. B., Rappaport, S. A., et al. 2021, AJ, 161, 162 [NASA ADS] [CrossRef] [Google Scholar]
- Prouza, M., Ebr, J., Mandat, D., et al. 2019, 36th Int. Cosmic Ray Conf., 36, 769 [NASA ADS] [CrossRef] [Google Scholar]
- Prša, A., & Zwitter, T. 2005, ApJ, 628, 426 [Google Scholar]
- Ricker, G. R., Winn, J. N., Vanderspek, R., et al. 2015, J. Astron. Telesc. Instrum. Syst., 1, 014003 [Google Scholar]
- Shappee, B. J., Prieto, J. L., Grupe, D., et al. 2014, ApJ, 788, 48 [Google Scholar]
- Southworth, J. 2012, Orbital Couples: Pas de Deux in the Solar System and the Milky Way, 51 [Google Scholar]
- Terrell, D., & Wilson, R. E. 2005, Ap&SS, 296, 221 [NASA ADS] [CrossRef] [Google Scholar]
- Tokovinin, A. 2018, ApJS, 235, 6 [NASA ADS] [CrossRef] [Google Scholar]
- Tokovinin, A. 2021, Universe, 7, 352 [NASA ADS] [CrossRef] [Google Scholar]
- Wilson, R. E., & Devinney, E. J. 1971, ApJ, 166, 605 [Google Scholar]
- Zacharias, N., Finch, C. T., Girard, T. M., et al. 2013, AJ, 145, 44 [Google Scholar]
- Zasche, P., Wolf, M., Vraštil, J., et al. 2014, A&A, 572, A71 [NASA ADS] [CrossRef] [EDP Sciences] [Google Scholar]
- Zasche, P., Vokrouhlický, D., Wolf, M., et al. 2019, A&A, 630, A128 [NASA ADS] [CrossRef] [EDP Sciences] [Google Scholar]
- Zasche, P., Henzl, Z., Lehmann, H., et al. 2020, A&A, 642, A63 [NASA ADS] [CrossRef] [EDP Sciences] [Google Scholar]
- Zasche, P., Henzl, Z., & Kára, J. 2022a, A&A, 659, A8 [NASA ADS] [CrossRef] [EDP Sciences] [Google Scholar]
- Zasche, P., Henzl, Z., & Mašek, M. 2022b, A&A, 664, A96 [NASA ADS] [CrossRef] [EDP Sciences] [Google Scholar]
All Tables
All Figures
|
Fig. 1. Light-curve fits of ASASSN-V J102911.57−522413.6 for both eclipsing pairs based on the PHOEBE fit and TESS data. |
| In the text | |
|
Fig. 2. ETV diagram of ASASSN-V J102911.57−522413.6 showing two sets of eclipses of A and B pairs as resulting from our analysis. The theoretical curve representing the fit given in Table 3 is plotted as a red solid curve, while the dots stand for primary eclipses and the open circles for secondary ones. The color denotes the different source of data with the legend in the lower part of the plot. |
| In the text | |
|
Fig. 3. Light-curve fits of V1037 Her for both A and B eclipsing pairs. |
| In the text | |
|
Fig. 4. ETV diagram of both pairs of V1037 Her. |
| In the text | |
|
Fig. 5. Light-curve fits of WISE J181904.2+241243 for both A and B eclipsing pairs. |
| In the text | |
|
Fig. 6. ETV diagram of both pairs of WISE J181904.2+241243. |
| In the text | |
|
Fig. 7. Light-curve fits of V2894 Cyg for both A and B eclipsing pairs. |
| In the text | |
|
Fig. 8. ETV diagram of both pairs of V2894 Cyg. |
| In the text | |
|
Fig. 9. Light-curve fits of NSVS 5725040 for both A and B eclipsing pairs. |
| In the text | |
|
Fig. 10. ETV diagram of both pairs of NSVS 5725040. |
| In the text | |
|
Fig. 11. Light-curve fits of WISE J210230.8+610816 for both A and B eclipsing pairs. |
| In the text | |
|
Fig. 12. ETV diagram of both pairs of WISE J210230.8+610816. |
| In the text | |
|
Fig. 13. Light-curve fits of ZTF J220518.78+592642.1 for both A and B eclipsing pairs. |
| In the text | |
|
Fig. 14. ETV diagram of both pairs of ZTF J220518.78+592642.1. |
| In the text | |
|
Fig. 15. Apsidal motion fits of four eccentric orbits: ASASSN-V J102911.57−522413.6: pair B, V2894Cyg: pair A, NSVS 5725040: pair A, and ZTF J220518.78+592642.1: pair A. For all the plots, these diagrams were obtained after subtraction of the ETVs of individual pairs only showing the long-term apsidal motions. Black dots represent the primary eclipses, blue ones are secondaries. |
| In the text | |
|
Fig. 16. Statistics of the period ratios of both inner pairs. Upper plot: blue columns showing all 2+2 quadruples, green data showing the other non-eclipsing 2+2 systems from the MSC catalogue, red data are the unconfirmed systems detected but still not published yet, and, finally, the magenta data are our new seven systems presented in the current paper. Middle plot: only the systems with temperatures below 7000 K. Bottom plot: only the early-type systems with Teff > 7000 K. |
| In the text | |
Current usage metrics show cumulative count of Article Views (full-text article views including HTML views, PDF and ePub downloads, according to the available data) and Abstracts Views on Vision4Press platform.
Data correspond to usage on the plateform after 2015. The current usage metrics is available 48-96 hours after online publication and is updated daily on week days.
Initial download of the metrics may take a while.