Fig. 4.
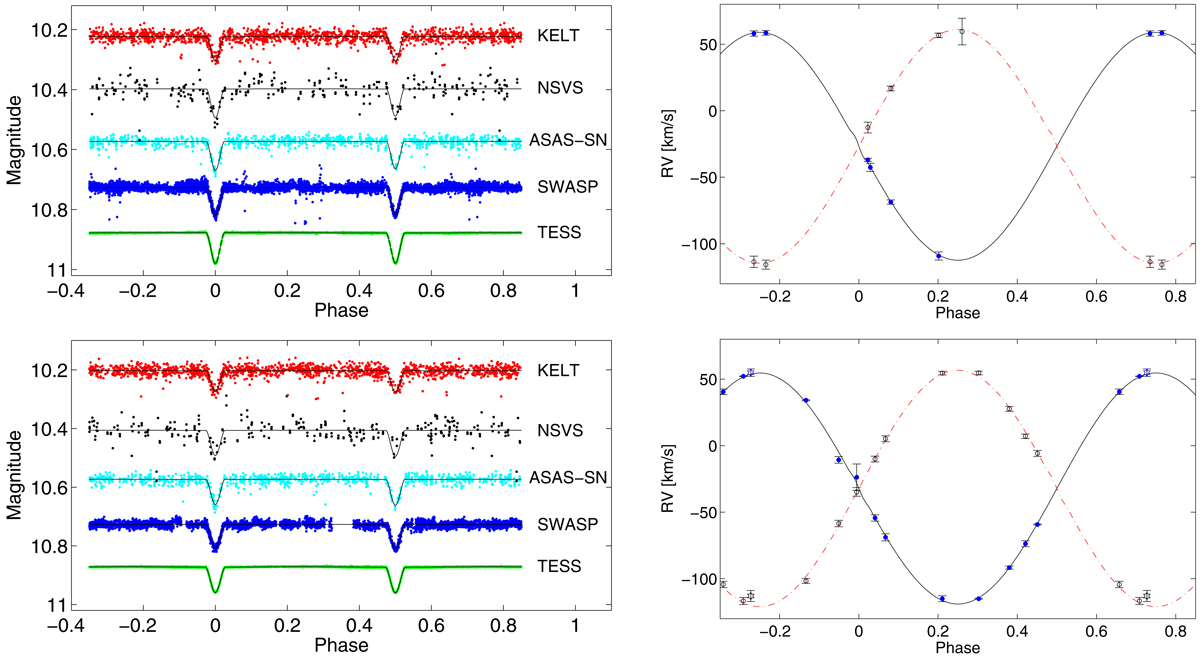
Light curves (left) and RV curves (right) of both pairs A (upper plots) and B (lower). For the RVs, the blue dots and solid line represent the observations and model of the primary pair, while the open circles and the dash-dotted curve represent the secondary components. One spectrum from Subaru was plotted using hexagram symbol.
Current usage metrics show cumulative count of Article Views (full-text article views including HTML views, PDF and ePub downloads, according to the available data) and Abstracts Views on Vision4Press platform.
Data correspond to usage on the plateform after 2015. The current usage metrics is available 48-96 hours after online publication and is updated daily on week days.
Initial download of the metrics may take a while.