Fig. 1.
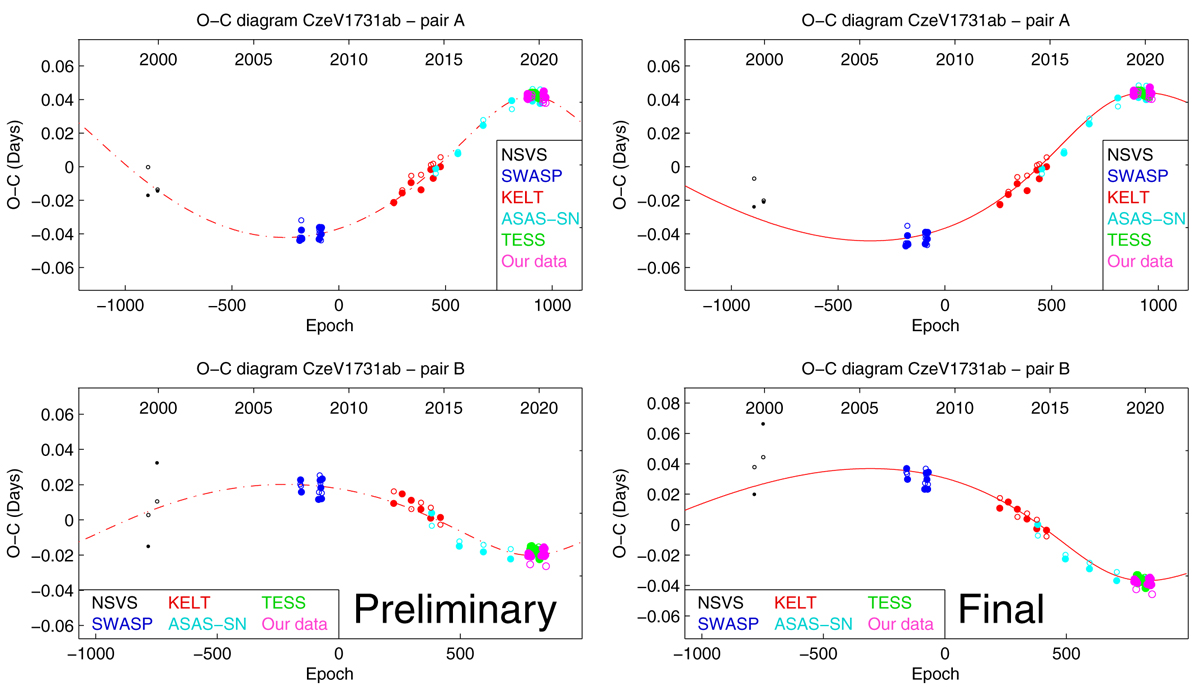
Analysis of period variations of both eclipsing pairs, with individual data sets labeled. The preliminary analysis is on the left-hand side and the final analysis is on the right-hand side of the figure. The filled dots stand for primary eclipses, while the open circles for the secondary eclipses. The larger the symbol, the higher the accuracy. See the text for details about the individual fits.
Current usage metrics show cumulative count of Article Views (full-text article views including HTML views, PDF and ePub downloads, according to the available data) and Abstracts Views on Vision4Press platform.
Data correspond to usage on the plateform after 2015. The current usage metrics is available 48-96 hours after online publication and is updated daily on week days.
Initial download of the metrics may take a while.