| Issue |
A&A
Volume 587, March 2016
|
|
|---|---|---|
| Article Number | A59 | |
| Number of page(s) | 20 | |
| Section | Interstellar and circumstellar matter | |
| DOI | https://doi.org/10.1051/0004-6361/201525702 | |
| Published online | 17 February 2016 | |
Online material
Appendix A: Inclusion of multiple sources of luminosity
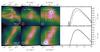 |
Fig. A.1
Two examples illustrating the effects of including multiple source of luminosity in the RADMC-3D models. From left to right: projected gas column density, with dots indicating protostars; 1100 μmRADMC-3D continuum images with only one source of luminosity; same continuum image, but with multiple sources of luminosity; SEDs of the systems, where the single-luminosity SED is indicated by the dashed line and the multiple-luminosity SED by the solid line. We have assumed a distance of 150 pc to the systems, and the continuum images have been convolved with a 4′′ beam. The white dashed box in the images show the size and shape of the aperture over which the flux is integrated to calculate the SEDs. Selected physical parameters and observables of the central protostars in the two examples are presented in Table A.1. |
| Open with DEXTER | |
This Appendix investigates the effects on the synthetic continuum images and SEDs of including multiple sources of luminosity in the RADMC-3D models. The discussion is based on the two examples shown in Fig. A.1.
The first example, shown at the top of Fig. A.1, is a system consisting of six protostars. The central protostar has a luminosity of 2.3 Lbol and an age of 15.3 kyr. Four of the five remaining protostars in the cut-out have luminosities <0.2 Lbol, while the fifth protostar, which lies at a distance of 1100 AU from the central protostar, has a luminosity of 29.7 Lbol. Table A.1 records selected physical parameters and observables of the system, for both one and multiple sources of luminosity. The methods used for obtaining the observables have not been adjusted to take into account that there are more source of luminosity in the models, but are the same as used in the main paper. The luminous protostar falls inside the aperture used for calculating the SED, which is consequently affected significantly. This has adverse effects on both the measured luminosity as well as Lsmm/Lbol. The measured fluxes, both interferometric and single-dish, are also affected by the addition of multiple luminosity sources. The interferometric flux, S50 kλ, 1.1 mm, is particularly affected since the method used to extract this flux is not sensitive to the location of the flux emission, but only the magnitude. With only one source of luminosity per model this approach poses no problem, but naturally overestimates the flux when multiple sources are included. The single-dish fluxes are also affected – the images in Fig. A.1 have been convolved with a 4′′ beam, which is seen to be a good enough resolution to separate the emission from central protostar from its more luminous countarpart. Still, S4′′, 1.1 mm, increases with a factor of 1.4 when going from one to multiple sources of luminosity. For the larger beam, S15′′, 0.85 mm, the situation is worse because the the two sources can no longer be separated.
The second example, shown at the bottom of Fig. A.1, is a system consisting of three protostars. The central protostar has a luminosity of 2.8 L⊙, and the most luminous of the two remaining stars, which is at a distance of 2100 AU from the central protostar, has a luminosity of 7.9 L⊙. The final protostar in the system has a luminosity <0.1 L⊙. The observables in this example are somewhat less affected by the inclusion of multiple sources of luminosity, partly because the distance to the neighbouring protostars is larger relative to the first example, partly because the additional sources of luminosities are order of magnitude brighter than the central protostar. This also means that the SED and S4′′, 1.1 mm are unaffected, while the interferometric flux and S15′′, 0.85 mm continue to be affected.
The analysis of the two examples show that the effects of introducing more than one source of luminosity into the models can have quite adverse effects on the observables. When analysing real observations, it is typically possible to extract the signal from the source one is interested in, while filtering away the signal from other nearby sources. Such work is often done on an object-by-object basis and may include the application of custom apertures, flagging part of the data, and subtracting the signal one is not interested in. It is, in principle, possible to do the same for the synthetic observations, but it is not feasible due to the vast number of models, which is why we decided on doing a simple pipeline analysis, made possible by only including one source of luminosity per model.
© ESO, 2016
Current usage metrics show cumulative count of Article Views (full-text article views including HTML views, PDF and ePub downloads, according to the available data) and Abstracts Views on Vision4Press platform.
Data correspond to usage on the plateform after 2015. The current usage metrics is available 48-96 hours after online publication and is updated daily on week days.
Initial download of the metrics may take a while.