Fig. A.1
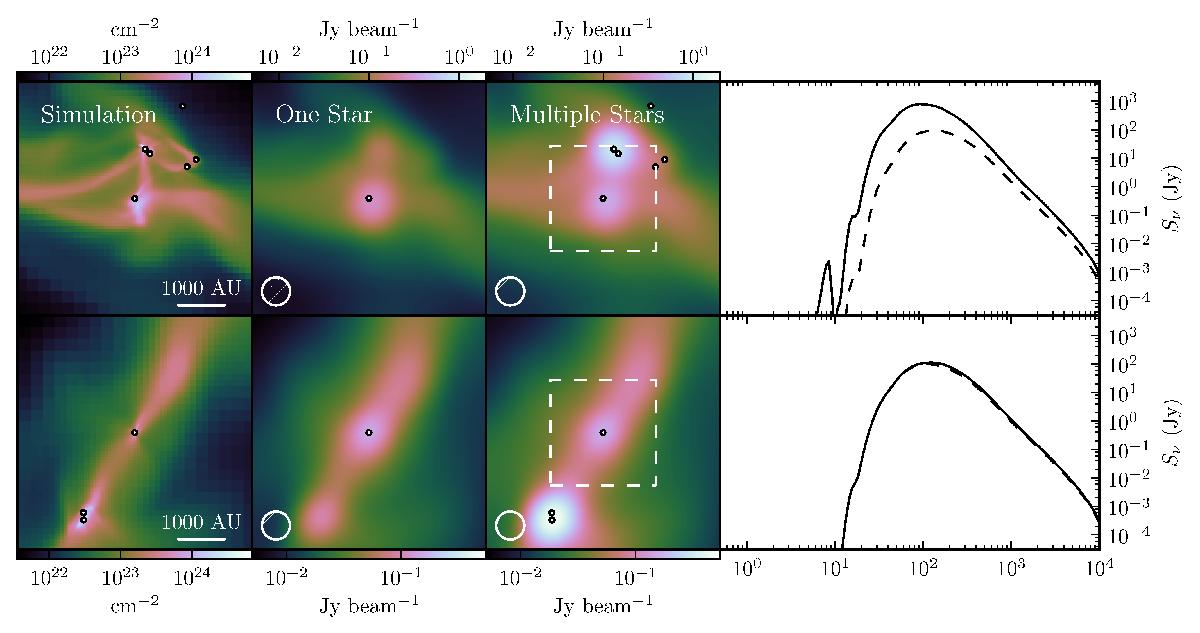
Two examples illustrating the effects of including multiple source of luminosity in the RADMC-3D models. From left to right: projected gas column density, with dots indicating protostars; 1100 μmRADMC-3D continuum images with only one source of luminosity; same continuum image, but with multiple sources of luminosity; SEDs of the systems, where the single-luminosity SED is indicated by the dashed line and the multiple-luminosity SED by the solid line. We have assumed a distance of 150 pc to the systems, and the continuum images have been convolved with a 4′′ beam. The white dashed box in the images show the size and shape of the aperture over which the flux is integrated to calculate the SEDs. Selected physical parameters and observables of the central protostars in the two examples are presented in Table A.1.
Current usage metrics show cumulative count of Article Views (full-text article views including HTML views, PDF and ePub downloads, according to the available data) and Abstracts Views on Vision4Press platform.
Data correspond to usage on the plateform after 2015. The current usage metrics is available 48-96 hours after online publication and is updated daily on week days.
Initial download of the metrics may take a while.