| Issue |
A&A
Volume 583, November 2015
|
|
|---|---|---|
| Article Number | A74 | |
| Number of page(s) | 15 | |
| Section | Stellar structure and evolution | |
| DOI | https://doi.org/10.1051/0004-6361/201526469 | |
| Published online | 29 October 2015 | |
Online material
Appendix A: Figures of the other stars
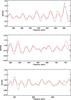 |
Fig. A.1
Fitted (red line) NAvPSD of KIC 7799349 by groups of nine peaks in the low-frequency range (p-modes). |
| Open with DEXTER | |
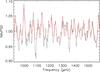 |
Fig. A.2
Fitted (red line) NAvPSD of KIC 7799349 in the high-frequency range (pseudo-modes). |
| Open with DEXTER | |
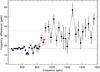 |
Fig. A.3
Consecutive frequency differences (KIC 7799349); that is, the separations between the fitted peaks for NAvPSD. Two levels are shown: one around Δν/ 2, corresponding to p-modes (blue dashed line with a weighted mean of 16.64 ± 0.09 μHz), and other around Δν, corresponding to pseudo-modes (blue dotted line with a weighted mean of 35.23 ± 1.52 μHz). The red symbol is the estimate of the acoustic cut-off frequency (895.47 ± 15.38 μHz). |
| Open with DEXTER | |
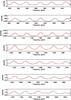 |
Fig. A.4
Fitted (red line) NavPSD of KIC 7940546 by groups of five peaks in the low-frequency range (p-modes). |
| Open with DEXTER | |
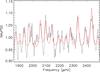 |
Fig. A.5
Fitted (red line) NAvPSD of KIC 7940546 in the high-frequency range (pseudo-modes). |
| Open with DEXTER | |
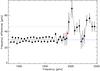 |
Fig. A.6
Consecutive frequency differences (KIC 7940546), that is, the separations between the fitted peaks for NAvPSD. Two levels are shown: one around Δν/ 2, corresponding to p-modes (blue dashed line with a weighted mean of 29.50 ± 0.07 μHz), and other around Δν, corresponding to pseudo-modes (blue dotted line with a weighted mean of 45.71 ± 2.12 μHz). The red symbol is the estimate of the acoustic cut-off frequency (1940.59 ± 20.71 μHz). |
| Open with DEXTER | |
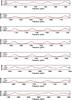 |
Fig. A.7
Fitted (red line) NAvPSD of KIC 9812850 by groups of four peaks in the low-frequency range (p-modes). |
| Open with DEXTER | |
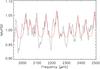 |
Fig. A.8
Fitted (red line) NAvPSD of KIC 9812850 in the high-frequency range (pseudo-modes). |
| Open with DEXTER | |
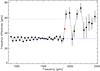 |
Fig. A.9
Consecutive frequency differences (KIC 9812850); that is, the separations between the fitted peaks for NAvPSD. Two levels are shown: one around Δν/ 2, corresponding to p-modes (blue dashed line with a weighted mean of 32.53 ± 0.12 μHz), and other around Δν, corresponding to pseudo-modes (blue dotted line with a weighted mean of 58.13 ± 2.39 μHz). The red symbol is the estimate of the acoustic cut-off frequency (1898.08 ± 24.29 μHz). |
| Open with DEXTER | |
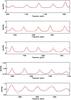 |
Fig. A.10
Fitted (red line) NAvPSD of KIC 11244118 by groups of five peaks in the low-frequency range (p-modes). |
| Open with DEXTER | |
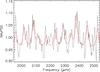 |
Fig. A.11
Fitted (red line) NAvPSD of KIC 11244118 in the high-frequency range (pseudo-modes). |
| Open with DEXTER | |
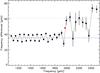 |
Fig. A.12
Consecutive frequency differences (KIC 11244118); that is, the separations between the fitted peaks for NAvPSD. Two levels are shown: one around Δν/ 2, corresponding to p-modes (blue dashed line with a weighted mean of 35.54 ± 0.08 μHz), and other around Δν, corresponding to pseudo-modes (blue dotted line with a weighted mean of 61.02 ± 2.19 μHz). The red symbol is the estimation of the acoustic cut-off frequency (1968.69 ± 21.48 μHz). |
| Open with DEXTER | |
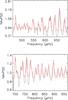 |
Fig. A.13
Fitted (red line) NAvPSD of KIC 11717120 by groups of sixteen peaks in the low-frequency range (p-modes). |
| Open with DEXTER | |
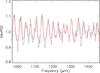 |
Fig. A.14
Fitted (red line) NAvPSD of KIC 11717120 in the high-frequency range (pseudo-modes). |
| Open with DEXTER | |
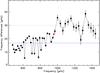 |
Fig. A.15
Consecutive frequency differences (KIC 11717120); that is, the separations between the fitted peaks for NAvPSD. Two levels are shown: one around Δν/ 2, corresponding to p-modes (blue dashed line with a weighted mean of 16.71 ± 0.09 μHz), and other around Δν, corresponding to pseudo-modes (blue dotted line with a weighted mean of 29.85 ± 0.66 μHz). The red symbol is the estimation of the acoustic cut-off frequency (958.38 ± 11.56 μHz). |
| Open with DEXTER | |
© ESO, 2015
Current usage metrics show cumulative count of Article Views (full-text article views including HTML views, PDF and ePub downloads, according to the available data) and Abstracts Views on Vision4Press platform.
Data correspond to usage on the plateform after 2015. The current usage metrics is available 48-96 hours after online publication and is updated daily on week days.
Initial download of the metrics may take a while.