Fig. A.12
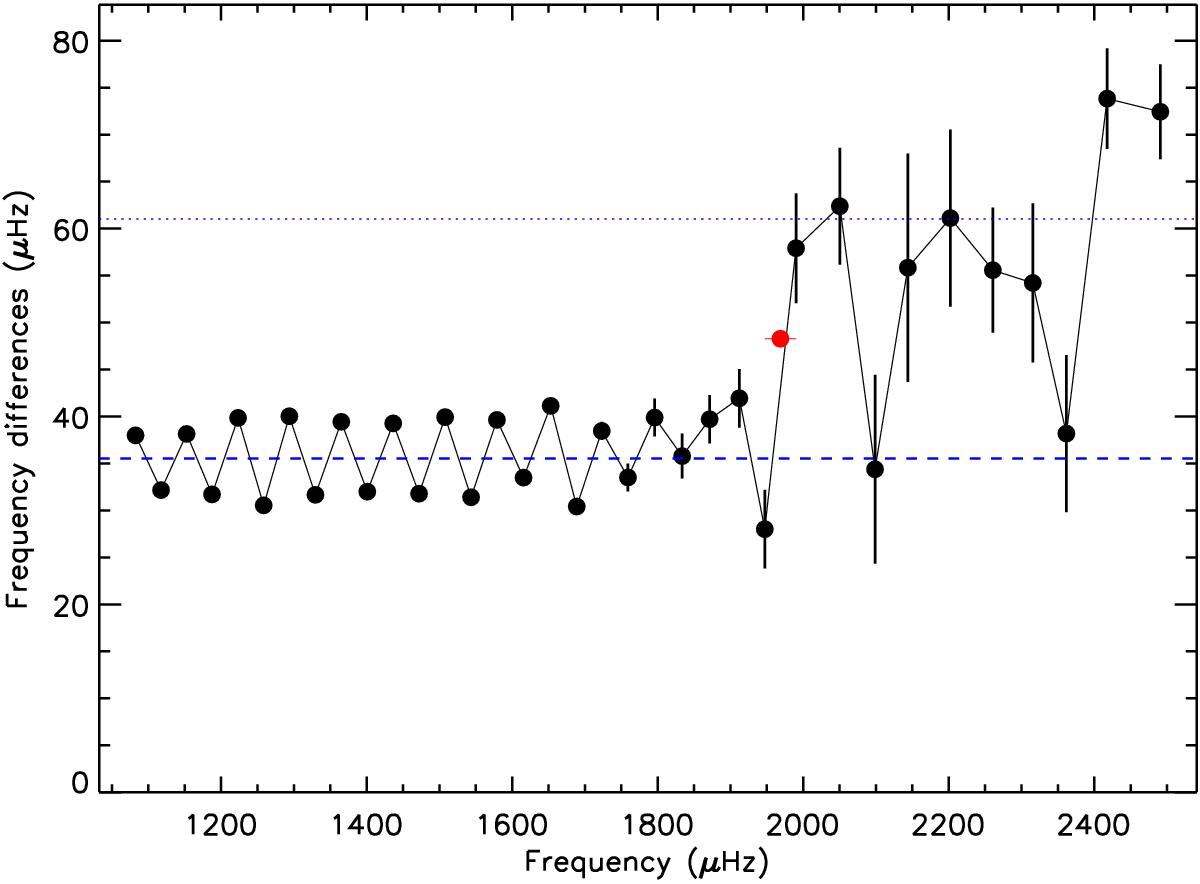
Consecutive frequency differences (KIC 11244118); that is, the separations between the fitted peaks for NAvPSD. Two levels are shown: one around Δν/ 2, corresponding to p-modes (blue dashed line with a weighted mean of 35.54 ± 0.08 μHz), and other around Δν, corresponding to pseudo-modes (blue dotted line with a weighted mean of 61.02 ± 2.19 μHz). The red symbol is the estimation of the acoustic cut-off frequency (1968.69 ± 21.48 μHz).
Current usage metrics show cumulative count of Article Views (full-text article views including HTML views, PDF and ePub downloads, according to the available data) and Abstracts Views on Vision4Press platform.
Data correspond to usage on the plateform after 2015. The current usage metrics is available 48-96 hours after online publication and is updated daily on week days.
Initial download of the metrics may take a while.