| Issue |
A&A
Volume 583, November 2015
|
|
|---|---|---|
| Article Number | A142 | |
| Number of page(s) | 15 | |
| Section | Cosmology (including clusters of galaxies) | |
| DOI | https://doi.org/10.1051/0004-6361/201526443 | |
| Published online | 06 November 2015 | |
Online material
Appendix A: HOD formalism
We applied halo occupation distribution (HOD) formalism to our adopted large-scale simulation of Cui et al. (2012) to construct the galaxy distribution. DM halos and subhalos represent tracers of the central galaxies and satellites, respectively (Peacock & Smith 2000; Kravtsov et al. 2004; van den Bosch et al. 2007). We thus started by producing a DM halo catalogue by applying the friend-of-friend (FoF) algorithm with linking length parameter b = 0.2 (in the units of the mean inter-particle separation) to the simulated data. This choice of the linking length value yields mass functions consistent with different theoretical predictions of the virial mass function (e.g. Gao et al. 2004; Springel 2005). The resulting FoF catalogue contains the position and the virial mass of each DM halo. In the following we describe how we used the FoF catalogue to obtain the magnitudes and positions of the galaxies.
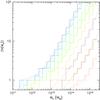 |
Fig. A.1
Halo occupation number, i.e. the mean number of galaxies in a halo of a given virial mass, is shown in different luminosity bins (colour coding as in Fig. A.3). The solid histograms represent the statistical realisations of the galaxies that populate the halos extracted from the (C12) simulation and their substructures. The dotted curve shows the predictions from Eq. (A.2) using the parameters in Zehavi et al. (2011). |
| Open with DEXTER | |
-
1.
For each DM halo we used its FoF mass from above to calculatethe virial radius Rvir, to know up to which scale to populate it with subhalos. This was done according to the spherical collapse formalism that yields the estimate of the virial overdensity Δvir(z) (e.g. Peebles 1980; Eke et al. 1996; Kitayama & Suto 1996; Bryan & Norman 1998). This is linked to the virial mass and the virial radius as
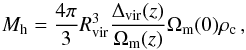 (A.1)where ρc(z) and Ωm(z) represent the critical density and the cosmological matter density parameter at redshift z, respectively.
 -
2.
We assigned each halo a concentration parameter according to mass-concentration relation of Bullock et al. (2001), assuming a log-normal scatter σlnc = 0.25 around the mean value.
-
3.
We populated each halo with subhalos by performing Monte Carlo realisations of the subhalo mass function model of Giocoli et al. (2010), which features both a redshift evolution and a concentration dependence on the subhalo mass function. The model assumes that the spatial distribution of the subhalos is less concentrated than the NFW DM profile (Navarro et al. 1996), since this includes the effects of dynamical friction and tidal stripping (Gao et al. 2004; van den Bosch et al. 2004; Giocoli et al. 2008). Accordingly, for each halo we now have subhalo populations with known positions and masses.
-
We then assigned each halo and subhalo with a galaxy with a luminosity value according to the abundance-matching approach (see e.g. Behroozi et al. 2010) as follows. At the core of the method is the halo occupation function
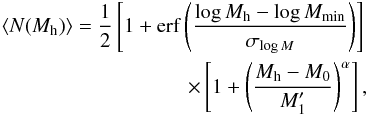 (A.2)which describes the mean number of halos within a parent halo of mass Mh (Zehavi et al. 2011).
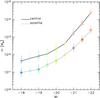
Fig. A.2 Median masses of parent halos (solid line and crosses) and subhalos (dotted line and dots), derived in Sect. 3.2, hosting galaxies with different r-band absolute magnitudes, when applying the HOD formalism to C12 simulations (colour coding as in Fig. A.3).
Open with DEXTER We then made the standard assumptions that: 1) all subhalos are populated by one galaxy only, i.e. the number of substructures into which we have resolved the parent halos is sufficient to host at most one galaxy; and 2) there are no “orphan” subhalos. The latter hypothesis is justified by the lack of evidence for massive dark halos with no baryon content. Based on these assumptions, Eq. (A.2)then describes the mean number of galaxies within a parent halo of mass Mh. The values of the parameters of Eq. (A.2)were found by Zehavi et al. (2011) by fitting the projected SDSS-DR7 2-point galaxy-galaxy correlation function of Abazajian et al. (2009) in the luminosity range Mr = −[18.5,22] , sampled in seven, equally spaced, bins. Consequently, the parameters of Eq. (A.2)are different for each luminosity bin. We then applied the method to our FoF DM halos obtained from the C12 simulations as follows: for a given parent halo of mass Mh, we use Eq. (A.2)to determine the mean number of galaxies at a given magnitude Mr (see Figs. A.1 and A.2). We repeated the procedure for each magnitude bin from Mr = −18.5 to Mr = −22, thus obtaining the luminosity function N(Lr) for a given host halo.
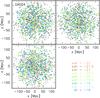
Fig. A.3 Three orthogonal projections of the distribution of satellite galaxies in centres of DM halos of ~1 Mpc radius in our adopted simulation of C12 (coloured dots). The colour coding indicates the magnitude of a given galaxy. The black dots show the positions of galaxies fainter than Mr = −18 that populate halo and subhalos in the simulation according to the mass function by Giocoli et al. (2010) down to 1010 M⊙.
Open with DEXTER We then ranked the above galaxies from most luminous to least luminous. For the same parent halo we went back to the subhalo distribution obtained above (Giocoli et al. 2010) and ranked the subhalos from most massive to least massive. We then matched the parent halo or its subhalo of a given mass ranking to a galaxy with the same luminosity ranking (most massive with the most luminous etc.) until all galaxies were assigned to the subhalos. We removed the low mass subhalos that were assigned to no galaxies. The outcome is a set of parent halos, extracted from the C21 simulation, containing a set of subhalos. Each halo and subhalo has a galaxy at its centre with known location and r-band luminosity (see Fig. A.3).
© ESO, 2015
Current usage metrics show cumulative count of Article Views (full-text article views including HTML views, PDF and ePub downloads, according to the available data) and Abstracts Views on Vision4Press platform.
Data correspond to usage on the plateform after 2015. The current usage metrics is available 48-96 hours after online publication and is updated daily on week days.
Initial download of the metrics may take a while.