Fig. A.1
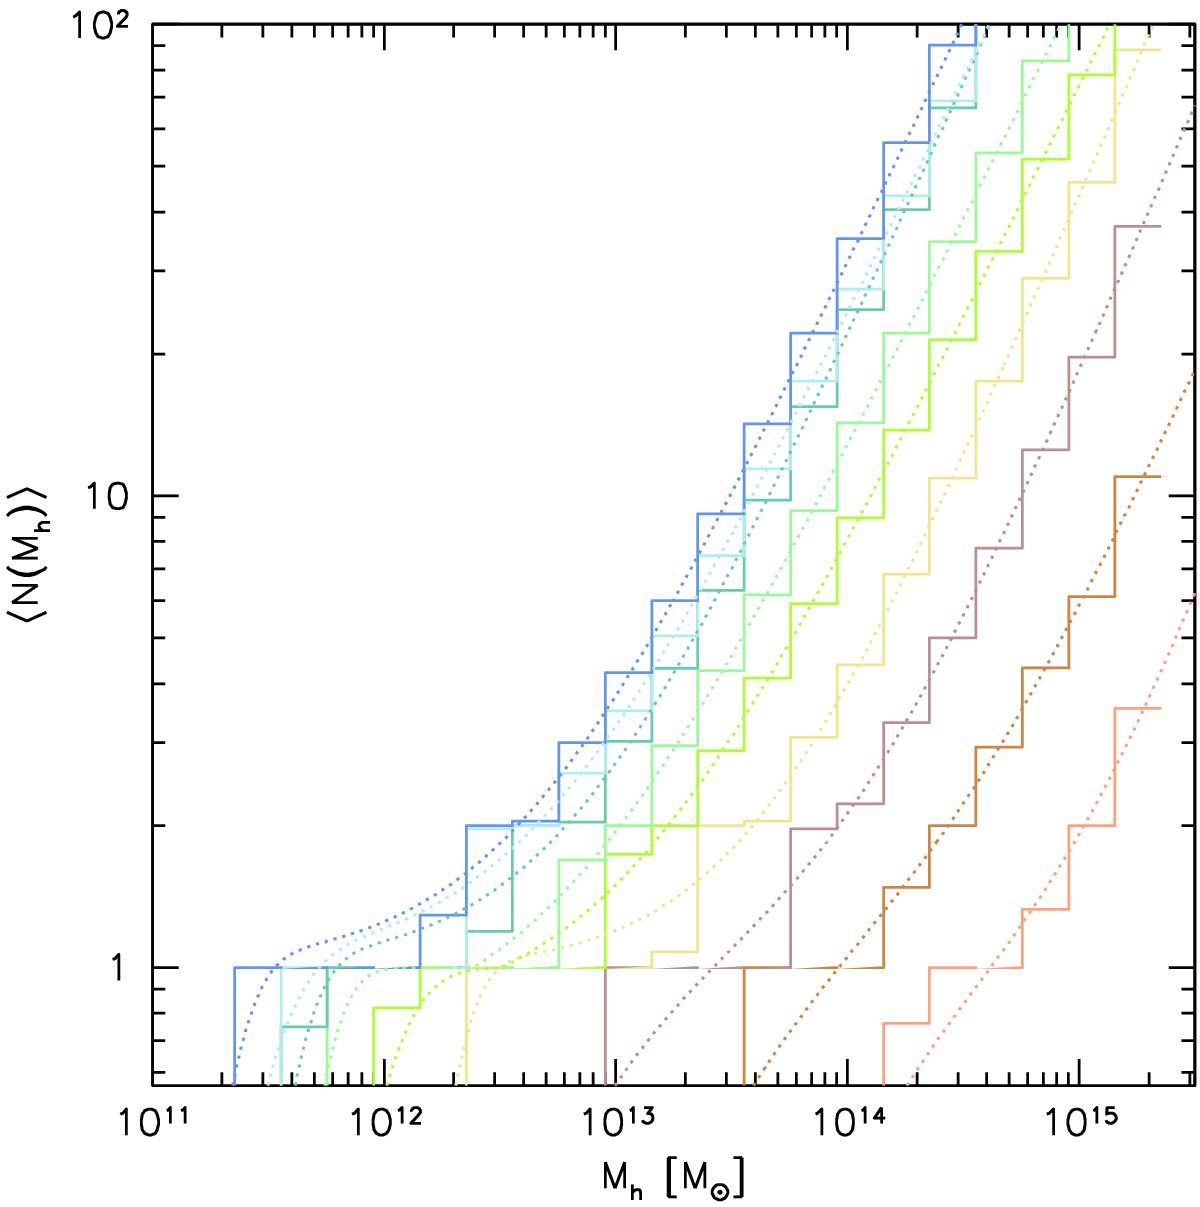
Halo occupation number, i.e. the mean number of galaxies in a halo of a given virial mass, is shown in different luminosity bins (colour coding as in Fig. A.3). The solid histograms represent the statistical realisations of the galaxies that populate the halos extracted from the (C12) simulation and their substructures. The dotted curve shows the predictions from Eq. (A.2) using the parameters in Zehavi et al. (2011).
Current usage metrics show cumulative count of Article Views (full-text article views including HTML views, PDF and ePub downloads, according to the available data) and Abstracts Views on Vision4Press platform.
Data correspond to usage on the plateform after 2015. The current usage metrics is available 48-96 hours after online publication and is updated daily on week days.
Initial download of the metrics may take a while.