Fig. A.3
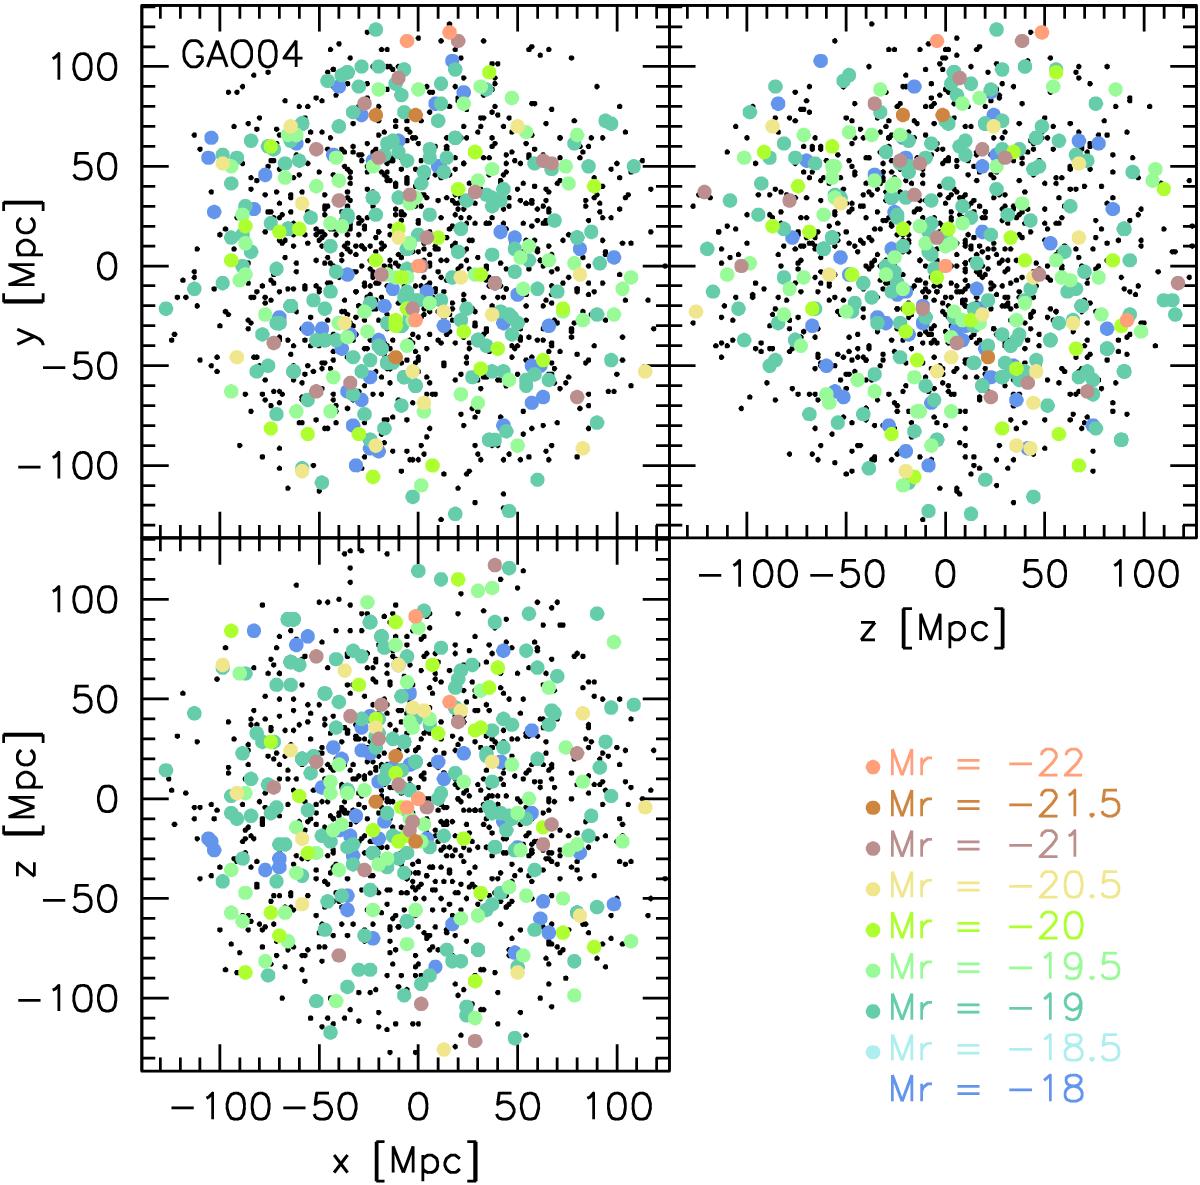
Three orthogonal projections of the distribution of satellite galaxies in centres of DM halos of ~1 Mpc radius in our adopted simulation of C12 (coloured dots). The colour coding indicates the magnitude of a given galaxy. The black dots show the positions of galaxies fainter than Mr = −18 that populate halo and subhalos in the simulation according to the mass function by Giocoli et al. (2010) down to 1010 M⊙.
Current usage metrics show cumulative count of Article Views (full-text article views including HTML views, PDF and ePub downloads, according to the available data) and Abstracts Views on Vision4Press platform.
Data correspond to usage on the plateform after 2015. The current usage metrics is available 48-96 hours after online publication and is updated daily on week days.
Initial download of the metrics may take a while.