| Issue |
A&A
Volume 582, October 2015
|
|
|---|---|---|
| Article Number | A112 | |
| Number of page(s) | 24 | |
| Section | Planets and planetary systems | |
| DOI | https://doi.org/10.1051/0004-6361/201526463 | |
| Published online | 20 October 2015 | |
Online material
Appendix A: Dispersal time of the disc
Observations have shown that the lifetime of protoplanetary discs is a around a few Myr (Hartmann et al. 1998). However, the fraction of stars with discs reduces greatly with increasing time (Mamajek 2009). In our nominal model, the lifetime of the disc is fixed to 3 Myr, where we follow the disc evolution of Hartmann et al. (1998). At 3 Myr the disc has reached a stellar accretion rate of Ṁ = 2 × 10⁻⁹ M⊙/yr. We then assume that the disc gets cleared by photoevaporation, so we stop our simulations at that time. However, the effects of photoevaporation are not clear and not constrained perfectly (Alexander et al. 2014), so that we now make the assumption that the disc will live longer, up to 5 Myr, where the disc will reach an accretion rate of Ṁ = 1 × 10⁻⁹ M⊙/yr (Hartmann et al. 1998). The additional lifetime of 2 Myr therefore only models the decay of the accretion rate from Ṁ = 2 × 10⁻⁹ M⊙/yr to Ṁ = 1 × 10⁻⁹ M⊙/yr.
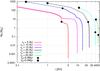 |
Fig. A.1
Evolution of planets that start at t0 = 2 Myr, but in discs that live up to tD = 3 Myr or tD = 5 Myr. The black circular symbols mark tD = 3 Myr, which corresponds to the final positions in Fig. 2. The black squares mark the final position at tD = 5 Myr. The evolution between 3 Myr and 5 Myr is indicated by the dashed lines. Clearly planets in the disc with longer lifetimes continue their evolution, so that the final dissipation time of the disc is very important to set the final mass and orbital position of planets. |
| Open with DEXTER | |
Starting from the same initial configuration as for Fig. 2, namely starting planets at different orbital distances when the disc has already evolved to tD = 2 Myr, results in Fig. A.1, where we present the growth tracks of planets in discs that live 3 Myr and 5 Myr. The planets are inserted at tD = 2 Myr, so they undergo 1 Myr or 3 Myr of evolution, respectively. The evolution of the planets in the disc that lives longer is identical to the disc that lives for a shorter time, because both discs have the same properties.
In the disc that lives longer, planets have more time for their evolution. This means that the planets, which have not contracted their gaseous envelope completely, can now do so and thus start rapid gas accretion. This is clearly seen for the planet in the inner system (Fig. A.1), which classified as an ice giant in the 3 Myr disc, while it is a hot gas giant in the disc that lives for 5 Myr. Similar fates are shared by the planets that form in the outer system. Those who already started rapid gas accretion accrete so much gas that the planet becomes massive enough that type-II migration shifts from disc-dominated to planet-dominated (Eq. (22)), reducing its migration speed. The ice giants in the outer disc now have more time to accrete pebbles and reach their isolation mass, so that they can contract their envelope and undergo runaway gas accretion, transforming them into gas giants. Even the planetary seed that would only grow to become an ice planet in a disc that lives 3 Myr (Fig. 2) evolves into a gas giant. This also indicates that the lifetime of the disc does not only play any role in terminating the growth of gas giants, but for planets in general.
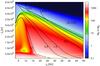 |
Fig. A.2
Final masses of planets as a function of initial radius r0 and initial time t0 in the disc, where Z = 1.0%, and a total disc lifetime of 5 Myr. The lines inside the plots correspond to the same meaning as the lines in Fig. 4. Clearly the formation of small planets is delayed to times after t0 = 3.5 Myr. |
| Open with DEXTER | |
In Fig. A.2 we present the r0–t0 map for a disc that undergoes 5 Myr of evolution. The general shape of the different regions where different planetary types emerge (e.g. gas giants, ice giants) is very similar to Fig. 4 where the disc lived for 3 Myr in total. The difference is now that the formation of all planetary types can start at 3.5 Myr, compared to ≈2 Myr in the disc that lives 3 Myr. Otherwise, the general results do not change. A longer disc lifetime transforms smaller planets to larger ons, because they have more time to grow, and reduces the final semi-major axis of those planets, because they have more time to migrate.
Appendix B: Constraints on the opacity during envelope contraction
After the core reaches pebble isolation mass, it hosts a gaseous envelope that first undergoes contraction on a long time scale, before runaway gas accretion can start. During this contraction phase, the envelope grows slowly until Mc = Menv, which is when rapid gas accretion can start. The accretion rate during the contraction phase is given by Eq. (17). The opacity κenv inside the envelope is crucial in determining the accretion rate during envelope contraction. Unfortunately, the opacity inside the planets envelope is poorly constrained (Ikoma et al. 2000). Not only is the size of the grains important for determining the opacity, but also the temperature in the planetary atmosphere. As grain growth can be efficient in planetary atmospheres (Mordasini 2014) and the temperature of a planet accreting gas is higher than the surrounding disc, the opacity of the planetary atmosphere is reduced compared to the opacity in the disc. Additionally, the opacity depends on the underlying chemical composition of the grains, which depend on the composition of the disc and the temperature in the disc.
The nominal opacity in Eq. (17) is set to κenv = 0.05cm2/ g. Further reductions in the opacity of the envelope result in faster contraction times of the envelope, so that Mc<Menv is reached at shorter times, allowing runaway gas accretion during the disc’s lifetime. In fact, a close-to-zero opacity allows rapid gas accretion onto cores of just 1 ME (Hori & Ikoma 2010). When setting κenv = 0.05cm2/ g, the contraction time of the envelope is roughly of the as the building time of the core via the pebble accretion shown in Fig. B.1. This value is very close to the estimate of opacity in the envelope of Movshovitz & Podolak (2008).
In Fig. B.1 we display the growth of a planet as a function of time. After the core has reached pebble isolation mass, the envelope starts to contract, where the opacity in the envelope κenv sets the contraction time. It clearly shows that higher opacity in the envelope prolongs the contraction time of the envelope.
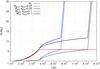 |
Fig. B.1
Mass of the planet as a function of time. The mass of the core (red line) increases via pebble accretion until isolation mass is reached at 350 kyr. Then the envelope starts to contract (dashed lines), which in increases the total mass (solid lines). The contraction time of the envelope depends on the opacity of the envelope κenv, where lower opacity results in a shorter contraction time, so that when Mc = Menv, rapid gas accretion can start. The planet is placed in a disc at t0 = 2 Myr at r0 = 10 AU. |
| Open with DEXTER | |
A prolongation of the contraction time has important consequences for the formation of planets, because the planet will then spend a longer time in type-I migration before it is massive enough to open a gap in the disc. This means that the distance the planet migrates from its initial position r0 is greater for a higher values κenv, unless the planet is caught in a region of outward migration. However, this can only happen in the early evolution stages of the disc. In the late stages of the disc evolution, a longer contraction time will lead to an enlargement of parameter space that allows for the formation of ice giants at a few AU, because these planets have very small cores and therefore do not contract an envelope.
Appendix C: Planet formation in the MMSN
To emphasize the importance of a realistic disc structure for the formation of planets, we tested our planet formation model also with a MMSN disc (Weidenschilling 1977b; Hayashi 1981). A simple power law disc was also used in Lambrechts & Johansen (2014), but with slightly different parameters compared to the MMSN. Here we directly probe the MMSN, where the discs surface density is given by ![]() (C.1)The aspect ratio of the disc follows
(C.1)The aspect ratio of the disc follows ![]() (C.2)which indicates that there are no planet traps due to the entropy driven corotation torque, because those traps exist only when H/r decreases with radius (Bitsch et al. 2014). The time evolution of the surface density is given by
(C.2)which indicates that there are no planet traps due to the entropy driven corotation torque, because those traps exist only when H/r decreases with radius (Bitsch et al. 2014). The time evolution of the surface density is given by 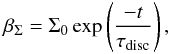 (C.3)where τdisc = 3 Myr and Σ0 = 1700 g/cm3. From this disc structure we model the formation of planets, and the resulting r0–t0 diagram is shown in Fig. C.1.
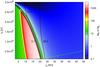 |
Fig. C.1
Final masses of planets as a function of initial radius r0 and initial time t0 in the MMSN with a lifetime of 3 Myr. The lines inside the plots correspond to the same meaning as the lines in Fig. 4. We again use a metallicity of pebbles of Z = 1.0%. In contrast to the disc model of Bitsch et al. (2015), the MMSN disc allows 0.1 AU <rf< 5.0 AU only for a very small amount of parameter space. Either the planets fall close to the central star (rf< 0.1 AU) or they stay outside of 5 AU. On the other hand, the parameter region that allows for the formation of ice giants is greatly increased compared to Fig. 4. |
| Open with DEXTER | |
The resulting planets look dramatically different from those in Fig. 4. In the inner regions of the disc (r0< 10 AU), the planets do not reach rapid gas accretion, because the migration in the inner disc is so rapid (because of the high surface density) that the planets arrive at rf< 0.1 AU before Mc<Menv. Planets that form farther outside can reach this stage (Mc<Menv), but their migration is still so rapid that they end up at rf< 0.1 AU. Nearly a third of the r0–t0 parameter space results in planets with rf< 0.1 AU. Only a very small band allows for the formation of planets with 0.1 AU <rf< 5.0 AU, where most of these planets have Mc>Menv, indicating that the formation of ice giants outside of 1 AU and inside of 5 AU is very hard in this disc model.
However, outside of 5 AU, a very large band allows for the formation of ice giants (green region in Fig. C.1). These ice giants have a much larger number of solids (~20–30 ME) compared to Fig. 4. This is caused by the higher aspect ratio in the MMSN disc, compared to our nominal disc model (Bitsch et al. 2015), which increases the pebble isolation mass (Eq. (16)). Additionally, in the MMSN disc model, only the surface density evolves in time, while the aspect ratio does not evolve, allowing a high pebble isolation mass in all disc evolution stages. In combination with the efficient pebble accretion, planets in this disc model will have a higher core mass than in the nominal disc model used in Fig. 4.
Appendix D: The heating torque
A recent study by Benítez-Llambay et al. (2015) shows that a small planet (MP< 5 ME) that accretes very quickly (mass doubling times shorter than 60 kyr) alters the structure of the surrounding gas disc in such a way that it can migrate outwards in the disc. The accreting material onto the planet causes asymmetries in the temperature of the disc close to the planet that produce a force that counteracts inward migration. This effect concerns planets that are so small that they had not yet reached the region of outward migration (see Fig. 1). Even if the mass doubling time is large, e.g. 300 kyr, the heating torque has an effect, because it reduces the inward speed of the planet compared to the nominal type-I migration rate.
This so-called heating torque is a strong function of the accretion rate onto the planet (only mass doubling times shorter than 60 kyr lead to outward migration) and of the opacity of the disc, which determines the cooling in the surrounding disc. Higher opacity suppresses cooling, which leads to a stronger effect of the heating torque. In their standard set-up, Benítez-Llambay et al. (2015) use a constant opacity of 1 cm2/ g, and the planet has a mass of 3 ME. The effect of the heating torque also depends on the mass of the planet. Unfortunately, this new effect is not quantified in a function that contains all relevant parameters (planetary mass, opacity of the disc, and mass doubling time). We therefore make a simple test, where we assume that the heating torque is just a function of the accretion rate and do not investigate effects of opacity and planetary mass in a detailed way. For that we use the data in the methods section of Benítez-Llambay et al. (2015).
We assume that the effect of the heating torque is equally strong until the planet reaches 5 ME, after which the heating torque is not relevant any more. Additionally, we assume just for the calculation of the heating torque that the opacity is equal to 1 cm2/ g, which is actually not the case in our disc. In fact, only in the inner parts of the disc, so close to the ice line, is the opacity higher than 1 cm2/ g in our disc model. Depending on the initial semi-major axis r0 and the initial time t0, the mass doubling time in our simulations can be a few kyr (small planet with ~0.5 ME, small r0, and small t0) up to a few 100 kyr (large planet, larger r0, and larger t0).
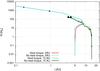 |
Fig. D.1
Two examples of the evolution of planets with and without heating torque. Both planets starting at 5 AU start at an early initial time t0 = 100 kyr, while the planets starting at 15 AU start at a late initial time of t0 = 2 Myr. The small black dots indicate a time difference of 200, 400, 600, and 800 kyr from the starting time. The big black dots indicate an evolution time of 1 Myr. The planets starting early and in the inner disc only evolve for ~500 kyr total. With the fast growth rates of pebble accretion, it seems that the heating torque only has minimal effects on the final configuration of evolving planets. |
| Open with DEXTER | |
In Fig. D.1 we display the evolution tracks of planets with and without the heating torque. In the example where the planets start at 5 AU, they are also inserted into the disc at an early time (t0 = 100 kyr). In the early disc, the region of outward migration is still very large (Fig. 1), so that planets that are massive enough (a few Earth masses) to reach this region and can grow there without migrating inwards. In this example, because r0 and t0 are small, the heating torque easily generates outward migration, and the planet ends up in the region of outward migration. However, the planet also reaches the region of outward migration when the heating torque is not taken into account, because the growth by pebble accretion is so fast that the planet does not migrate much during this time. Both planets then end up on the same evolution track, because they reach the region of outward migration where their previous migration history no longer matter.
The planets starting at 20 AU in Fig. D.1 also start later in the disc at t0 = 2 Myr. There the planets do not reach a region of outward migration. Additionally, the mass doubling time becomes longer than 60 kyr for most of the growth stages of the planets, so that the heating torque does not prevent inward migration, but just slows it down. However, even this slowing down has an effect on the final orbital mass and position of the planet. The planet that grows when we take the heating torque into account has a somewhat larger final semi major axis, but reaches a similar final planetary mass. The reason for this effect not seeming too important here is that small mass bodies migrate quite slowly, and they also grow quite quickly thanks to pebble accretion, so that they reach 5 ME rather quickly, so that the planet experiences the effects of the heating torque for only a small amount of time.
The general results of our simulations, for example Fig. 4, still holds, even when taking the heating torque into account. The only thing that changes is that the final orbital positions rf of the planets are slightly larger, meaning that a smaller r0 is needed to achieve a certain final orbital position rf. In the simple test here, the initial semi-major axis can be up to 2 AU smaller in order to achieve the same rf for a given t0 compared to simulations where the heating torque is not taken into account, making the effect in a global picture not that important here.
This effect seems to not be too important in the pebble accretion scenario because of the fast growth rates. The fast growth rates for reaching MP> 5 ME mean that there is only a short time for the planet to actually spend migrating. The resulting difference between simulations with and without heating torque where the accretion rates are high is therefore minimal. However, the heating torque could have substantial effects when the accretion rate is low, and the heating torque reduces the torque causing inward migration. In Cossou et al. (2014) the growth of planetary cores is modelled in N-body simulations via the collision of planetesimals. There the production of the cores of giant planets at large orbits is hindered by the fact that planets migrate inwards too fast below the region of outward migration (because the planets are not massive enough and do not grow fast enough), which results in many super-Earth types of planets instead of giant planets. Including the heating torque this picture could change, because the inward migration speed is reduced for these small objects, which could allow them to grow more and reach the region of outward migration. Additionally, if the metallicity caused by μm sized dust grains is greater than the 0.5% as in our work, the heating torque could become more prominent, because it strongly increases with increasing opacity, which directly scales with the metallicity.
Appendix E: Type-III migration and dynamical corotation torque
When a planet is big enough to carve a gap around its orbit, the horseshoe region becomes depleted. However, when the mass pushed away by the planet is higher than the mass of the planet itself (the co-orbital mass deficit), the planet can undergo a rapid change of semi-major axis, which is described as type-III migration (Masset & Papaloizou 2003). Migrating planets also experience dynamical torques, which are proportional to the migration rate and depend on the background vortensity gradient (Paardekooper 2014). Here we want to discuss how these effects influence our models. The description of how these mechanisms work can be found in Sect. 2.4.
In Fig. E.1 we have indicated the planets that would either undergo type-III migration or are subject to dynamical corotation torques (everything below the green and purple lines in Fig. E.1) resulting in the fact that the final orbital positions in these regions are not exactly marked by the black lines. The final orbital positions are most likely closer to the host star, because the runaway type-III migration follows the direction of motion, which is inwards in regions outside of r> 12 AU (Fig. 1). This process only occurs in the early stages of the disc evolution, where the disc is still massive. In the later stages of the disc evolution, the disc is less massive, and these effects are not significant any more, making the predictions of our model reliable in this part of parameter space.
Simulations with a larger number of pebbles can form gas giants more easily and in a larger parameter space in r0–t0 (Fig. 5). A larger number of pebbles results in a faster growth of the planetary core, which then can contract its envelope faster as well, leading to a total faster growth of the planet. This means the planet will reach the mass where it starts to open a gap partially in the disc earlier as well. However, in an earlier stage of evolution, the disc is also more massiv, indicating that the co-orbital mass deficit is larger as well, making the planet more prone to type-III migration. The same effect applies for the dynamical corotation torque. In the situation of a larger number of pebbles
in the disc, a greater number of planets in the r0–t0 parameter space are affected by type-III migration and dynamical corotation torques (Fig. E.1).
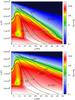 |
Fig. E.1
Final masses of planets as a function of initial radius r0 and initial time t0 in the disc with Z = 1.0% (top) and Z = 1.5% (bottom). The lines inside the plots correspond to the same meaning as the lines in Fig. 4. Planets below the purple line are subject to dynamical corotation torques (Paardekooper 2014), while planets below the green line are subject to type-III migration (Masset & Papaloizou 2003), indicating that their final orbital position does not correspond exactly to the position indicated by the black lines. |
| Open with DEXTER | |
© ESO, 2015
Current usage metrics show cumulative count of Article Views (full-text article views including HTML views, PDF and ePub downloads, according to the available data) and Abstracts Views on Vision4Press platform.
Data correspond to usage on the plateform after 2015. The current usage metrics is available 48-96 hours after online publication and is updated daily on week days.
Initial download of the metrics may take a while.