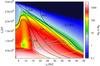
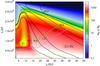
Fig. E.1

Final masses of planets as a function of initial radius r0 and initial time t0 in the disc with Z = 1.0% (top) and Z = 1.5% (bottom). The lines inside the plots correspond to the same meaning as the lines in Fig. 4. Planets below the purple line are subject to dynamical corotation torques (Paardekooper 2014), while planets below the green line are subject to type-III migration (Masset & Papaloizou 2003), indicating that their final orbital position does not correspond exactly to the position indicated by the black lines.
Current usage metrics show cumulative count of Article Views (full-text article views including HTML views, PDF and ePub downloads, according to the available data) and Abstracts Views on Vision4Press platform.
Data correspond to usage on the plateform after 2015. The current usage metrics is available 48-96 hours after online publication and is updated daily on week days.
Initial download of the metrics may take a while.