| Issue |
A&A
Volume 580, August 2015
|
|
|---|---|---|
| Article Number | A36 | |
| Number of page(s) | 24 | |
| Section | Interstellar and circumstellar matter | |
| DOI | https://doi.org/10.1051/0004-6361/201525990 | |
| Published online | 23 July 2015 | |
Online material
Appendix A: Maps of titanium dioxide emission
Figures A.1 to A.15 show channel maps of the detected TiO2 emission lines (Table 2, Fig. 1) at a velocity resolution of 2 km s-1, covering the range −14 ≤ νLSR ≤ 78 km s-1. This νLSR-range covers the bulk of all TiO2 emission; emission at
more extreme velocities is no longer visible in the channel maps. Figure A.16 shows integrated-intensity maps for all listed lines, covering the νLSR-ranges indicated in Table 2. Figure A.17 shows a comparison of the TiO2 line emission to the south-west tail detected at 310.78 GHz, which is discussed in Sects. 3.1 and 4.4.
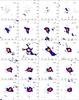 |
Fig. A.1
Channel maps of the TiO2 emission at 310.55 GHz, at a 2 km s-1 velocity resolution. Black contours show the continuum measured with ALMA at 321 GHz (O+15; R+14). The stellar position is indicated with a white cross. Spatial scales are indicated in the top left panel and are the same for all panels. The colour scale starts at the 3σ level and is plotted as the square root of the flux for increased contrast. |
| Open with DEXTER | |
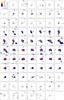 |
Fig. A.2
Same as Fig. A.1, but for TiO2 emission at 310.78 GHz. |
| Open with DEXTER | |
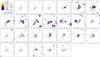 |
Fig. A.3
Same as Fig. A.1, but for TiO2 emission at 311.46 GHz. |
| Open with DEXTER | |
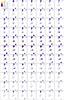 |
Fig. A.4
Same as Fig. A.1, but for TiO2 emission at 312.25 GHz. |
| Open with DEXTER | |
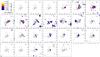 |
Fig. A.5
Same as Fig. A.1, but for TiO2 emission at 312.73 GHz. |
| Open with DEXTER | |
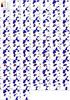 |
Fig. A.6
Same as Fig. A.1, but for TiO2 emission at 312.82 GHz. |
| Open with DEXTER | |
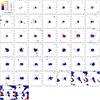 |
Fig. A.7
Same as Fig. A.1, but for TiO2 emission at 321.40 GHz. Artefacts in channels with νLSR ≥ 55 km s-1 are due to the presence of strong SO2 emission. See also Fig. 1. |
| Open with DEXTER | |
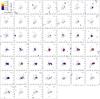 |
Fig. A.8
Same as Fig. A.1, but for TiO2 emission at 321.50 GHz. |
| Open with DEXTER | |
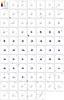 |
Fig. A.9
Same as Fig. A.1, but for TiO2 emission at 322.33 GHz. |
| Open with DEXTER | |
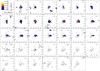 |
Fig. A.10
Same as Fig. A.1, but for TiO2 emission at 322.61 GHz. |
| Open with DEXTER | |
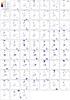 |
Fig. A.11
Same as Fig. A.1, but for TiO2 emission at 324.49 GHz. |
| Open with DEXTER | |
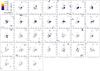 |
Fig. A.12
Same as Fig. A.1, but for TiO2 emission at 324.96 GHz. |
| Open with DEXTER | |
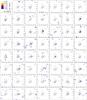 |
Fig. A.13
Same as Fig. A.1, but for TiO2 emission at 325.32 GHz. |
| Open with DEXTER | |
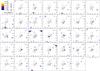 |
Fig. A.14
Same as Fig. A.1, but for TiO2 emission at 325.50 GHz. |
| Open with DEXTER | |
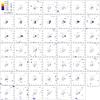 |
Fig. A.15
Same as Fig. A.1, but for TiO2 emission at 325.60 GHz. |
| Open with DEXTER | |
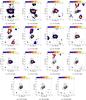 |
Fig. A.16
Integrated-intensity maps of TiO2 emission. Colour maps show the intensity integrated over the νLSR-ranges indicated in Table 2 and Fig. 1 and cut off at 3σ. Contours show the ALMA 321 GHz continuum. Labels indicate the positions of the star (+, VY) and the continuum component (x, C) to the south-east (O+15; R+14), and the position and approximate extent of the south-west clump of Shenoy et al. (2013, SW and a dashed 1′′. The presence of cleaning artefacts, mainly at ~312 GHz, is addressed in Sect. 2. |
| Open with DEXTER | |
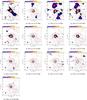 |
Fig. A.17
Comparison of TiO2 emission lines listed in Table 2 to south-west tail at 310.78 GHz (red contours) and HST image (black contours). Emission integrated over 19 ≤ νLSR ≤ 22 km s-1 plotted at > 3σ (colour scale). Emission of 311.46 GHz was omitted since the relevant νLSR-range is not covered by the observations. |
| Open with DEXTER | |
© ESO, 2015
Current usage metrics show cumulative count of Article Views (full-text article views including HTML views, PDF and ePub downloads, according to the available data) and Abstracts Views on Vision4Press platform.
Data correspond to usage on the plateform after 2015. The current usage metrics is available 48-96 hours after online publication and is updated daily on week days.
Initial download of the metrics may take a while.