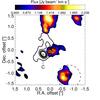
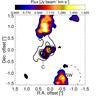
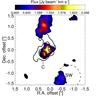
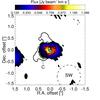
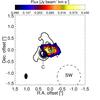
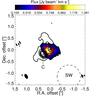
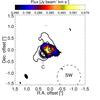
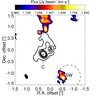
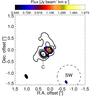
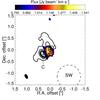
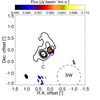
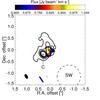
Fig. A.16
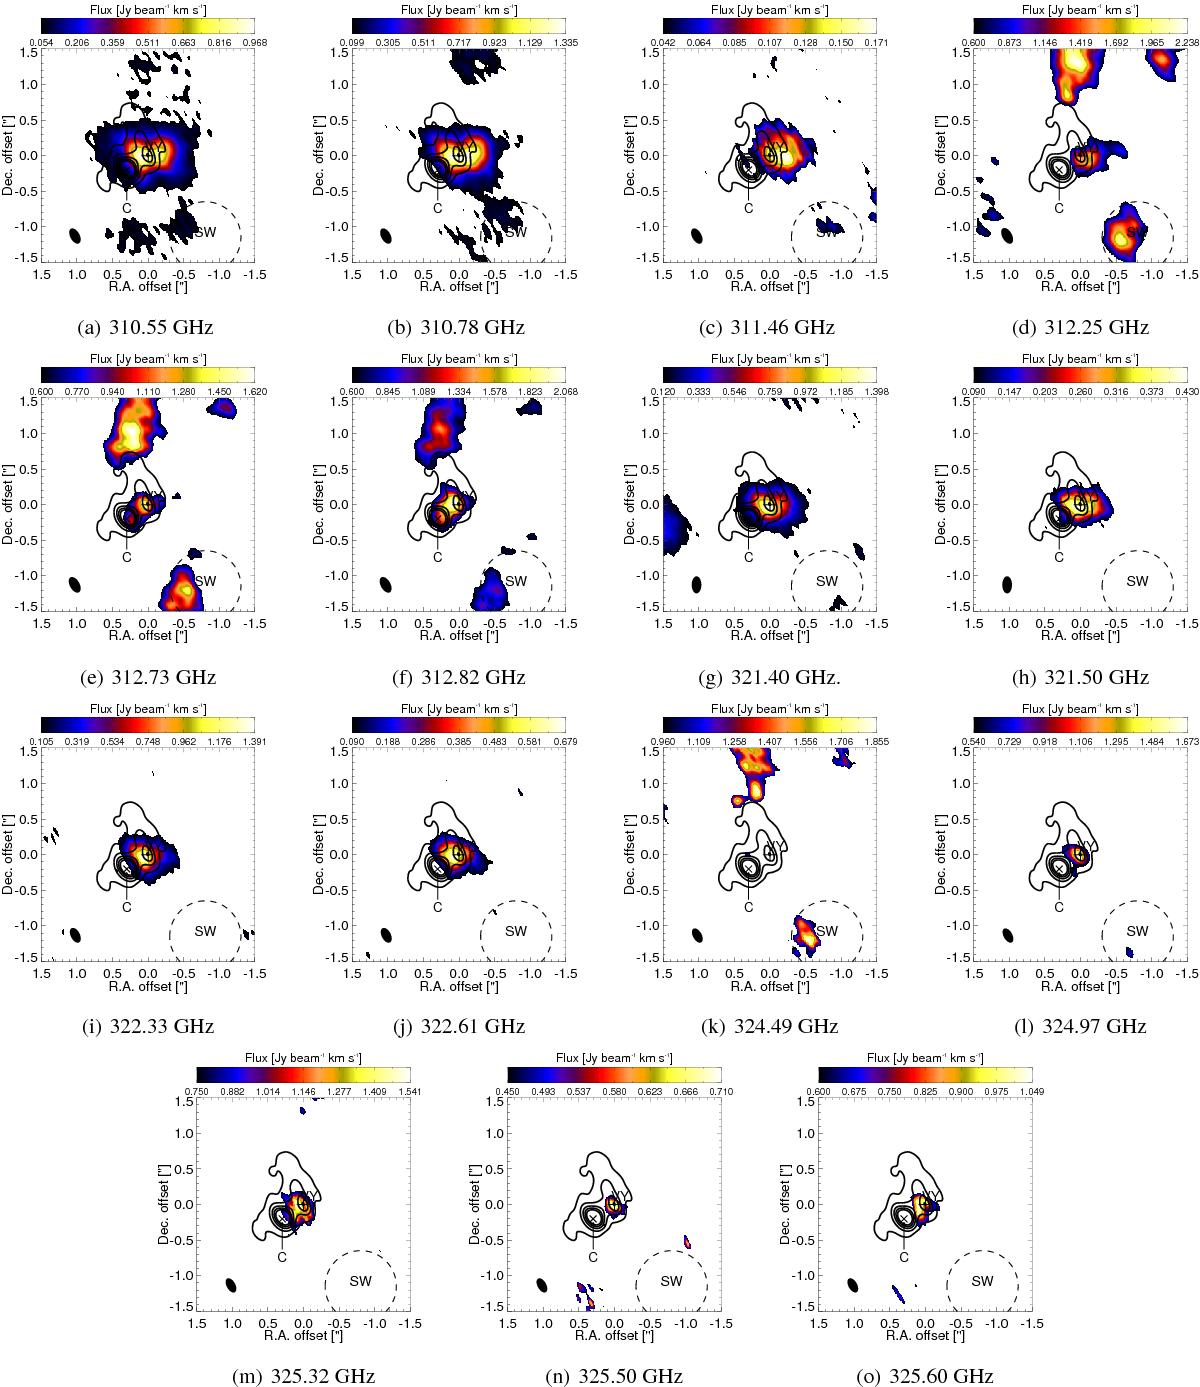
Integrated-intensity maps of TiO2 emission. Colour maps show the intensity integrated over the νLSR-ranges indicated in Table 2 and Fig. 1 and cut off at 3σ. Contours show the ALMA 321 GHz continuum. Labels indicate the positions of the star (+, VY) and the continuum component (x, C) to the south-east (O+15; R+14), and the position and approximate extent of the south-west clump of Shenoy et al. (2013, SW and a dashed 1′′. The presence of cleaning artefacts, mainly at ~312 GHz, is addressed in Sect. 2.
Current usage metrics show cumulative count of Article Views (full-text article views including HTML views, PDF and ePub downloads, according to the available data) and Abstracts Views on Vision4Press platform.
Data correspond to usage on the plateform after 2015. The current usage metrics is available 48-96 hours after online publication and is updated daily on week days.
Initial download of the metrics may take a while.