Fig. A.1
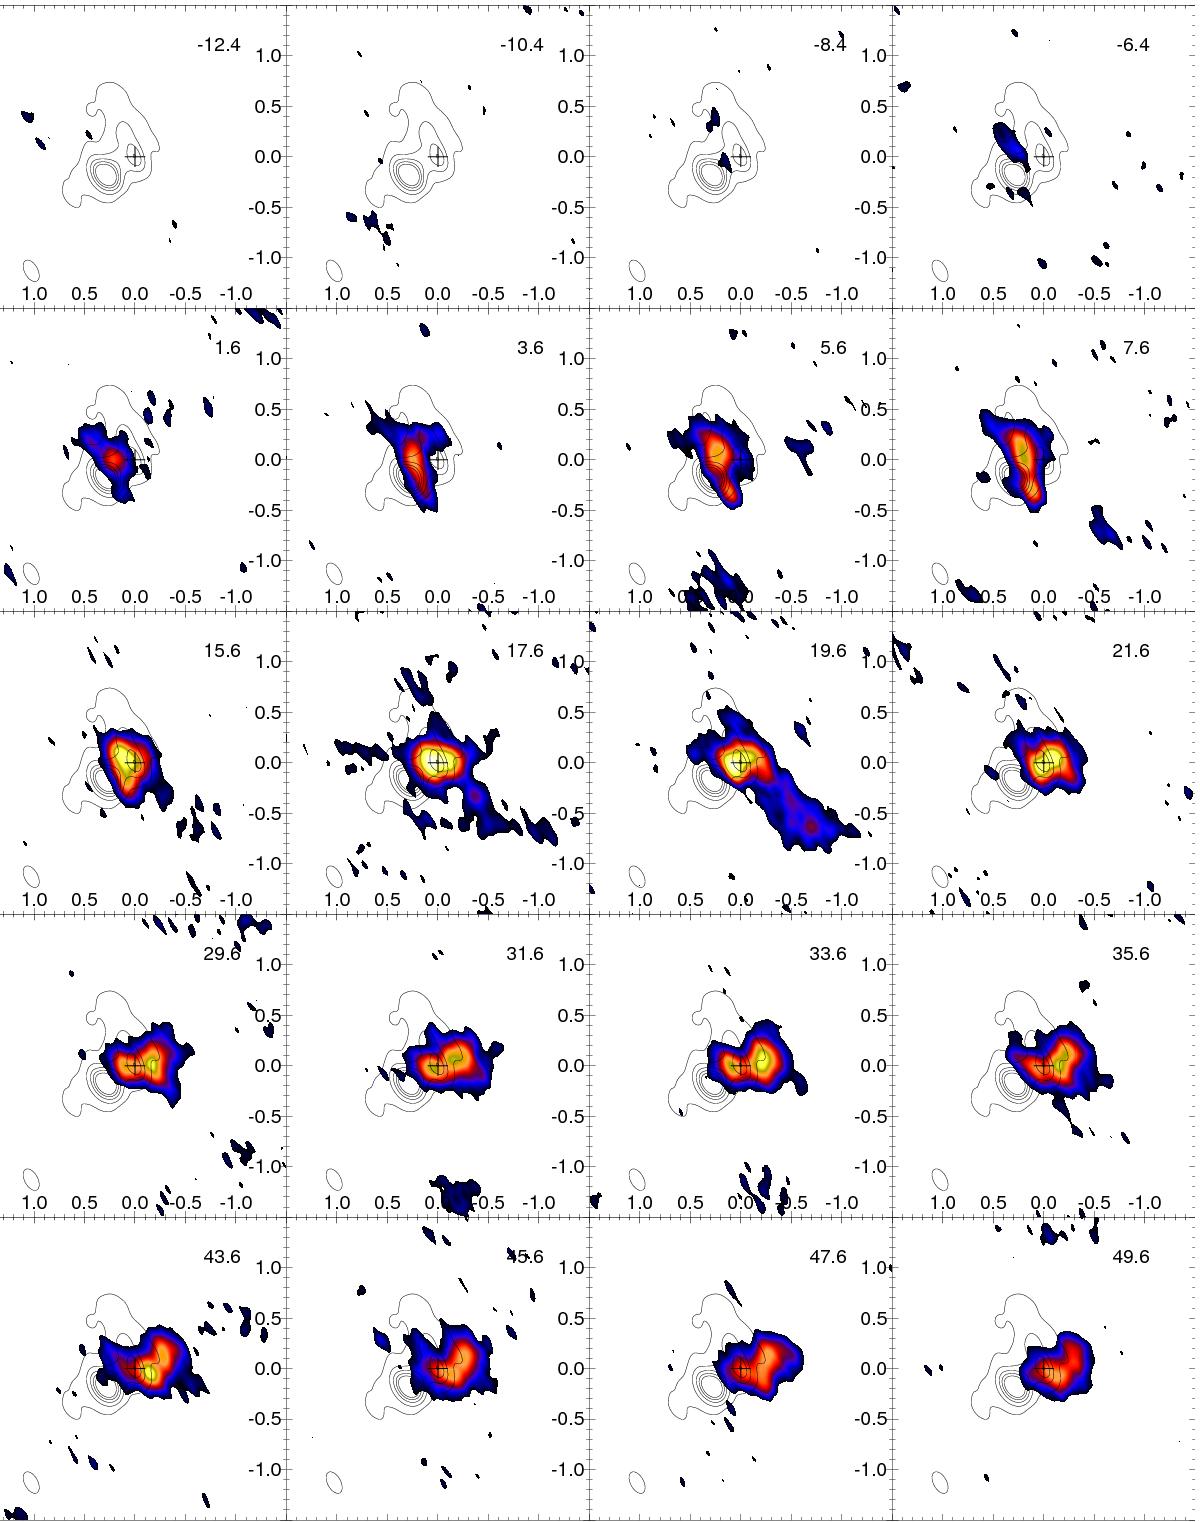
Channel maps of the TiO2 emission at 310.55 GHz, at a 2 km s-1 velocity resolution. Black contours show the continuum measured with ALMA at 321 GHz (O+15; R+14). The stellar position is indicated with a white cross. Spatial scales are indicated in the top left panel and are the same for all panels. The colour scale starts at the 3σ level and is plotted as the square root of the flux for increased contrast.
Current usage metrics show cumulative count of Article Views (full-text article views including HTML views, PDF and ePub downloads, according to the available data) and Abstracts Views on Vision4Press platform.
Data correspond to usage on the plateform after 2015. The current usage metrics is available 48-96 hours after online publication and is updated daily on week days.
Initial download of the metrics may take a while.