| Issue |
A&A
Volume 578, June 2015
|
|
|---|---|---|
| Article Number | A137 | |
| Number of page(s) | 12 | |
| Section | The Sun | |
| DOI | https://doi.org/10.1051/0004-6361/201425236 | |
| Published online | 17 June 2015 | |
Online material
Appendix A: GOLF/SoHO low-degree acoustic oscillation frequencies
Table A.1 illustrates the content of the frequency tables made available electronically through this work. They contain the central frequencies of the low-degree acoustic modes of oscillations of the Sun extracted from 365-day subseries of 18 yr of GOLF/SoHO observations between 1996 April 11, and 2014 March 5. As a four-time overlap of 91.25 days was used, a total of 69 frequency tables are provided. We note that one of every four frequency tables contains frequencies extracted from independent subseries; see Sect. 2 for a detailed description of the methodology used to extract the mode frequencies. Quality criteria were defined based on the fitted mode parameters and their associated uncertainties in order to remove outliers: 1) the error of the mode frequency must be less than its mode width; 2) the signal-to-noise ratio must be larger than 1; and 3) the mode width must be larger than the frequency resolution. The entire set of tables containing the GOLF l = 0, 1, 2, and 3 p-mode frequencies between 1500 μHz and 4000 μHz and their associated formal 1σ uncertainties are available in a machine readable format at CDS. The GOLF velocity time series used in this work and the extracted frequency tables are directly available on the GOLF website at CEA4 and through the SoHO data archive at NASA and ESA.
Acoustic oscillation frequencies of the l = 0, 1, 2, and 3 modes extracted from the 365-day GOLF/SoHO spectrum calculated between 1996 April 11, and 1997 April 10.
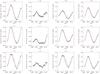 |
Fig. B.1
Temporal variations in μHz of the frequency shifts, ⟨ Δνn,l = 0 ⟩, ⟨ Δνn,l = 1 ⟩, ⟨ Δνn,l = 2 ⟩, at each individual angular degree l (from top to bottom), and calculated for four different frequency ranges with the QBO signature removed (black dots). From left to right, the frequency ranges are the following: a) 1800 μHz ≤ ν< 3790μHz; b) 1800 μHz ≤ ν< 2450μHz; c) 2450 μHz ≤ ν< 3110μHz; and d) 3110 μHz ≤ ν< 3790μHz. The 10.7 cm radio flux, F10.7, smoothed in the same way and scaled to match the rising phase and maximum of Cycle 23, is shown as a proxy of the solar surface activity (solid line). |
| Open with DEXTER | |
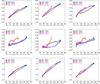 |
Fig. B.2
Frequency shifts, ⟨ Δνn,l = 0 ⟩, ⟨ Δνn,l = 1 ⟩, ⟨ Δνn,l = 2 ⟩, at each individual angular degree l = 0, 1, and 2 (from left to right), as a function of the corresponding 10.7 cm radio flux, F10.7, and calculated for three different frequency ranges once the QBO signature was removed. From top to bottom, the frequency ranges are the following: a) 1800 μHz ≤ ν< 3790μHz; b) 1800 μHz ≤ ν< 2450μHz (low-frequency range); and c) 3110 μHz ≤ ν< 3790μHz (high-frequency range). The rising (black dots) and declining (blue dots) phases of Cycle 23, and the rising phase (red dots) of Cycle 24 are indicated by different colors. |
| Open with DEXTER | |
Appendix B: Frequency shifts at individual angular degree
Figure B.1 shows the temporal variations of the frequency shifts, ⟨ Δνn,l = 0 ⟩, ⟨ Δνn,l = 1 ⟩, and ⟨ Δνn,l = 2 ⟩, at each individual angular degree l. The shifts were calculated over four frequency ranges: 1800 μHz ≤ ν< 3790μHz; 1800 μHz ≤ ν< 2450μHz (the low-frequency range); 2450 μHz ≤ ν< 3110μHz (the mid-frequency range); and 3110 μHz ≤ ν< 3790μHz (the high-frequency range). The QBO signature was removed by applying a proper smoothing of 2.5 yr as prescribed in Fletcher et al. (2010) for the four frequency ranges and for the 10.7 cm radio flux. We note that in order to avoid misinterpretation due to possible border effects introduced by the smoothing, we do not consider the extreme points corresponding to the first three and the last three points of the smoothed data. Each frequency range is sensitive to different depths in the sub-surface layers of the Sun, as calculated by Basu et al. (2012). The averaged kernels of the mid- and high-frequency ranges have their largest sensitivities at 0.9981 R⊙ (i.e., 1300 km) and 0.9989 R⊙ (i.e., 760 km), respectively, while the low-frequency modes peak deeper in the solar interior at 0.9965 R⊙ (i.e., 2400 km); see Sect. 3 for results of the frequency shifts averaged over the modes l = 0, 1, and 2, ⟨ Δνn,l = 0, 1, 2 ⟩.
While the temporal variations of the frequency shifts at l = 0, 1, and 2 show a good agreement with the 10.7 cm radio flux for the mid- and high-frequency modes, clear differences between the two quantities can be seen for the low-frequency modes. A residual after removing the QBO is still present in the l = 0 and l = 2 modes. The longer period observed in the low-frequency modes starting around 2006 and mentioned in Sect. 3 appears in the l = 0 and l = 2 modes only. On the other hand, the low-frequency l = 1 has a very different behavior. After a long period between 2004 and 2010 of practically no changes, a sharp increase of the l = 1 frequency shifts is measured starting from 2011, which is actually not present in the other angular degrees.
Figure B.2 shows the same frequency shifts, ⟨ Δνn,l = 0 ⟩, ⟨ Δνn,l = 1 ⟩, ⟨ Δνn,l = 2 ⟩, at each individual angular degree l, but as a function of the corresponding 10.7 cm radio flux, F10.7. Both quantities were properly smoothed as in Fletcher et al. (2010). The shifts obtained over three frequency ranges are represented: 1800 μHz ≤ ν< 3790μHz; 1800 μHz ≤ ν< 2450μHz (the low-frequency range); and c) 3110 μHz ≤ ν< 3790μHz (the high-frequency range). Different colors are used for the three different phases of solar activity: a) the rising phase of Cycle 23 going from 1996 April to 2001 October; b) the declining phase of Cycle 23 going from 2001 October to 2009 January; and c) the rising phase of Cycle 24 going from 2009 January to 2014 April (see Sect. 3 for more details). Again, the low-frequency
modes show a very different behavior from the higher-frequency modes. Moreover, a longer period than the quasi-biennial oscillation is observed for the radial and quadrupole modes during the rise of Cycle 24, while the dipole modes show a very distinct behavior.
© ESO, 2015
Current usage metrics show cumulative count of Article Views (full-text article views including HTML views, PDF and ePub downloads, according to the available data) and Abstracts Views on Vision4Press platform.
Data correspond to usage on the plateform after 2015. The current usage metrics is available 48-96 hours after online publication and is updated daily on week days.
Initial download of the metrics may take a while.