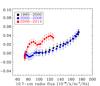
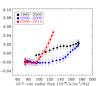
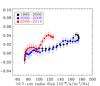
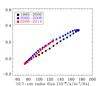
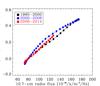
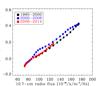
Fig. B.2
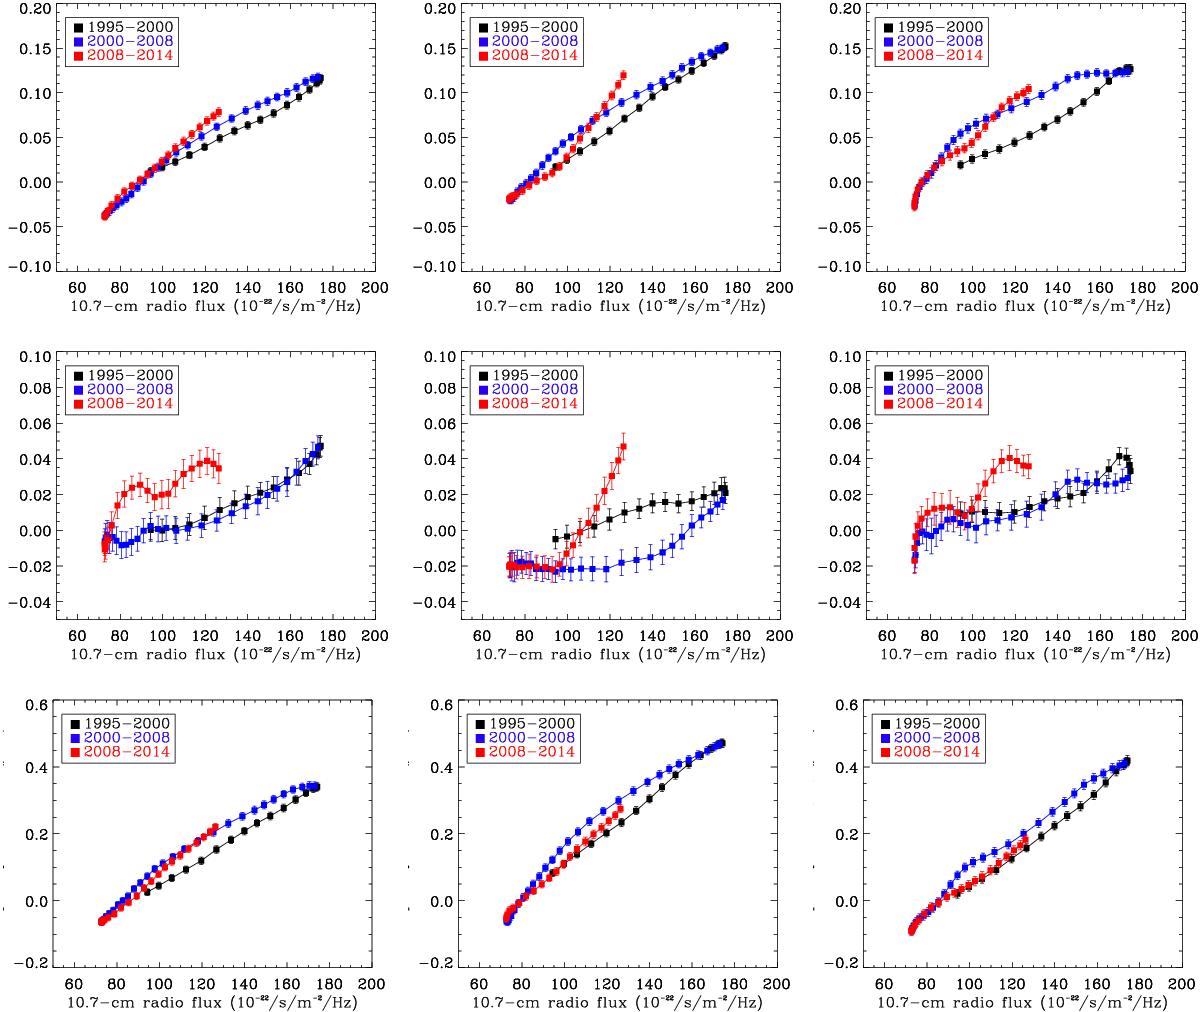
Frequency shifts, ⟨ Δνn,l = 0 ⟩, ⟨ Δνn,l = 1 ⟩, ⟨ Δνn,l = 2 ⟩, at each individual angular degree l = 0, 1, and 2 (from left to right), as a function of the corresponding 10.7 cm radio flux, F10.7, and calculated for three different frequency ranges once the QBO signature was removed. From top to bottom, the frequency ranges are the following: a) 1800 μHz ≤ ν< 3790μHz; b) 1800 μHz ≤ ν< 2450μHz (low-frequency range); and c) 3110 μHz ≤ ν< 3790μHz (high-frequency range). The rising (black dots) and declining (blue dots) phases of Cycle 23, and the rising phase (red dots) of Cycle 24 are indicated by different colors.
Current usage metrics show cumulative count of Article Views (full-text article views including HTML views, PDF and ePub downloads, according to the available data) and Abstracts Views on Vision4Press platform.
Data correspond to usage on the plateform after 2015. The current usage metrics is available 48-96 hours after online publication and is updated daily on week days.
Initial download of the metrics may take a while.