| Issue |
A&A
Volume 576, April 2015
|
|
|---|---|---|
| Article Number | A35 | |
| Number of page(s) | 11 | |
| Section | Interstellar and circumstellar matter | |
| DOI | https://doi.org/10.1051/0004-6361/201424845 | |
| Published online | 23 March 2015 | |
Online material
Appendix A: Methylamine and other transitions
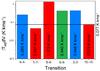 |
Fig. A.1
Bargraph plot of the integrated main-beam intensities for the six investigated methylamine transitions. |
| Open with DEXTER | |
All identified transitions for the sources G31.41+0.31 and W3(H2O), with integrated peak area listed.
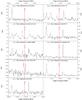 |
Fig. A.2
Blow-up of the spectral region around the 22→ 21 transition at 237143 MHz of all analysed hot cores. Despite being a particularly strong transition, it was not observed in any of the spectra. |
| Open with DEXTER | |
Appendix B: ALMA
In the following figure the simulated spectrum of methylamine is shown for a column density of 1.0 × 1015 cm-2 at an excitation temperature of 120 K. Simulations were done with CASSIS using the JPL spectroscopic database. The frequency ranges were taken to cover ALMA Bands 6 and 7. The resolution was set at 0.1 MHz for this spectrum.
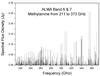 |
Fig. B.1
211 to 373 GHz spectrum of methylamine, covering ALMA bands 6 and 7. A column density of 1015 cm-2, Trot and beam size of 1′′ are used. |
| Open with DEXTER | |
Methylamine transition target candidates for ALMA Band 6 and 7.
© ESO, 2015
Current usage metrics show cumulative count of Article Views (full-text article views including HTML views, PDF and ePub downloads, according to the available data) and Abstracts Views on Vision4Press platform.
Data correspond to usage on the plateform after 2015. The current usage metrics is available 48-96 hours after online publication and is updated daily on week days.
Initial download of the metrics may take a while.