Fig. A.1
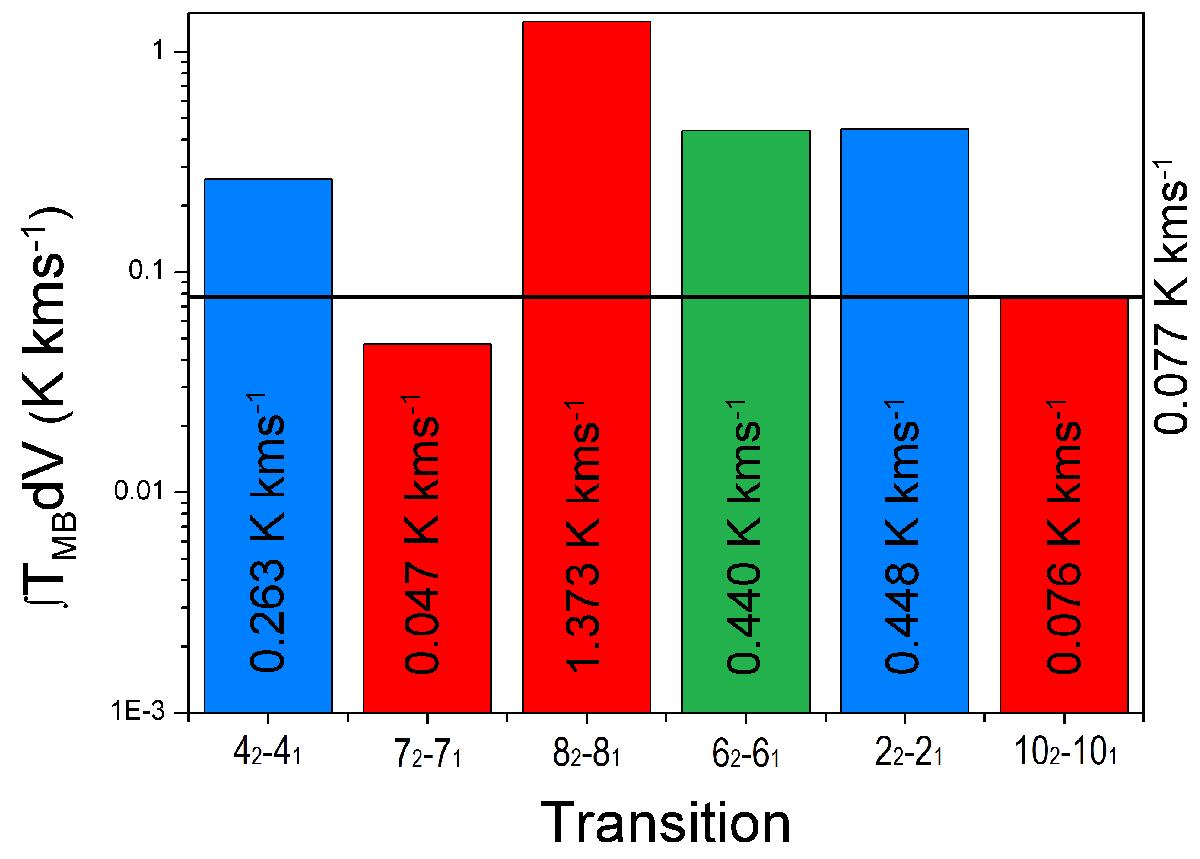
Bargraph plot of the integrated main-beam intensities for the six investigated methylamine transitions. ![]() values were calculated for a total column density of 3.4 × 1017 cm-2 as inferred toward G31.41+0.31 from the 62 → 61 transition, assuming a rotational temperature of 120 K. The horizontal line shows the 0.077 K km s-1 3σ value for G31.41+0.31. It is unlikely that the detection of the 236 408 feature (green) in this hot core is methylamine, since the main-beam intensities of other CH3NH2 transitions are above the 3σ value. Particularly the 42 → 41 and 22 → 21 transition (blue) should be visible in our spectra. The remaining transitions (red) are either below detection limit or not observed toward this source.
values were calculated for a total column density of 3.4 × 1017 cm-2 as inferred toward G31.41+0.31 from the 62 → 61 transition, assuming a rotational temperature of 120 K. The horizontal line shows the 0.077 K km s-1 3σ value for G31.41+0.31. It is unlikely that the detection of the 236 408 feature (green) in this hot core is methylamine, since the main-beam intensities of other CH3NH2 transitions are above the 3σ value. Particularly the 42 → 41 and 22 → 21 transition (blue) should be visible in our spectra. The remaining transitions (red) are either below detection limit or not observed toward this source.
Current usage metrics show cumulative count of Article Views (full-text article views including HTML views, PDF and ePub downloads, according to the available data) and Abstracts Views on Vision4Press platform.
Data correspond to usage on the plateform after 2015. The current usage metrics is available 48-96 hours after online publication and is updated daily on week days.
Initial download of the metrics may take a while.