| Issue |
A&A
Volume 575, March 2015
|
|
|---|---|---|
| Article Number | A108 | |
| Number of page(s) | 11 | |
| Section | Cosmology (including clusters of galaxies) | |
| DOI | https://doi.org/10.1051/0004-6361/201425122 | |
| Published online | 04 March 2015 | |
Online material
Appendix A: Other figures
This appendix presents the mass function of RS and of R+BCG galaxies in RXJ1347 and in MACJ0329 at various clustercentric radii.
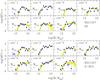 |
Fig. A.1
Mass function of red sequence (upper panels) and red galaxies plus BCG (lower panels) of RXJ1347 in various clustercentric radial bins, as detailed in the panels. Caption as in Fig. 1. |
| Open with DEXTER | |
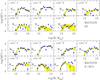 |
Fig. A.2
As previous figure, but for MACSJ0329. |
| Open with DEXTER | |
Appendix B: Fitting details and systematics
A proper estimation of the error is paramount to properly claim as significant a stellar-to-total matter (or M/L) ratio radial trend. In general, our stellar mass errors are much larger than those returned by procedures adopted in literature, sometime by a factor of 10 because these works chose not to include in the error budget terms that we instead consider important, for example Poisson fluctuations of the total number of background galaxies and of their number at a given mass. We see no reason why the background population in the cluster and control field lines of sight should be exactly average in number and total mass. We verified the existence of these well-known fluctuations by splitting the reference line of sight in parts. These number and mass fluctuations make the stellar mass in the background population subject to fluctuations much larger than those coming from photometric errors alone (i.e., the stochastic mass errors). This is a large source of uncertainty at all clustercentric radii except at the cluster center, where the background contamination is minimal. It is modeled in our work, but rarely included in previous works. Second, in addition to these Poisson fluctuations, the parameters that describe the mass distribution of background galaxies are measured with a finite precision, and we need to marginalize over this uncertainty too (i.e., over the uncertainty of the parameters describing the average expected background population). This marginalization is
naturally implemented in our Bayesian approach. This error term is minor for our own analysis because a large solid angle observed in fully homogeneous conditions is available for the mean background estimation, but is major, yet neglected, in some works. Third, given the extreme depth of our data, the stellar mass at masses lower than the mass completeness limit is negligible for whatever faint-end slope α> −2 for our study. Nevertheless, we account for it by marginalizion. Data of such depth are rare at best in the literature, yet we are aware of no previous work computing the stellar-to-total matter (or M/L) ratio profile that marginalizes over the faint-end slope uncertainty. Indeed, most studies do not even account for the possible different faint-end slope at different cluster-centric radii.
Some works use spectroscopic samples. Although the background contamination can be derived using spectroscopic redshifts, the sample with spectroscopic data is only a fraction of the whole sample needed to measure the total stellar mass, and the background contribution has to be inferred for the subsample without spectroscopic data. This is achieved by taking the estimate derived from the spectroscopic sample, assuming that there are no background fluctuations between the spectroscopic and photometric sample, and that the derived correction is perfectly known, none of which is true. Therefore, and for the same reasons just discussed, works using spectroscopic samples also have been too optimistic in their estimation of the stellar mass errors.
© ESO, 2015
Current usage metrics show cumulative count of Article Views (full-text article views including HTML views, PDF and ePub downloads, according to the available data) and Abstracts Views on Vision4Press platform.
Data correspond to usage on the plateform after 2015. The current usage metrics is available 48-96 hours after online publication and is updated daily on week days.
Initial download of the metrics may take a while.