| Issue |
A&A
Volume 574, February 2015
|
|
|---|---|---|
| Article Number | A77 | |
| Number of page(s) | 32 | |
| Section | Stellar structure and evolution | |
| DOI | https://doi.org/10.1051/0004-6361/201424672 | |
| Published online | 28 January 2015 | |
Online material
Appendix A: Physical quantity maps for different clump parameters
The density zoom, tracer, pressure, ratio of momentum-flux to pressure, and velocity maps are presented in Figs. A.1–A.15 for different clump parameters: χ = 10 and Rc = 1 a; χ = 10 and Rc = 5 a; and χ = 30 and Rc = 1 a.
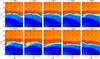 |
Fig. A.1
Zoom-in of the density distribution by colour for the case with clump parameters χ = 10 and Rc = 1 a for the times shown at the top of each plot. The coloured arrows represent the three-velocity at different locations (β = v/c). The axes units are a = 8 × 1010 cm. The pulsar and the star are located at (r,z) = (0,5 a) and (r,z) = (0,60 a), respectively. |
| Open with DEXTER | |
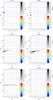 |
Fig. A.2
Tracer distribution by colour for the case with clump parameters χ = 10 and Rc = 1 a for the times shown at the top of each plot. The tracer value ranges from 0 (pulsar and stellar wind) to 1 (clump). The remaining plot properties are the same as those of Fig. A.1. |
| Open with DEXTER | |
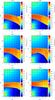 |
Fig. A.3
Pressure distribution in units of ρ0c2 by colour for the case with clump parameters χ = 10 and Rc = 1 a for the times shown at the top of each plot. The remaining plot properties are the same as those of Fig. A.1. |
| Open with DEXTER | |
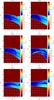 |
Fig. A.4
Momentum flux over pressure distribution by colour for the case with clump parameters χ = 10 and Rc = 1 a for the times shown at the top of each plot. The momentum flux is given by Fp = ρ Γ2v2(1 + ϵ + P/ρ) + P. The remaining plot properties are the same as those of Fig. A.1. |
| Open with DEXTER | |
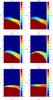 |
Fig. A.5
β distribution by colour for the case with clump parameters χ = 10 and Rc = 1 a for the times shown at the top of each plot. The remaining plot properties are the same as those of Fig. A.1. |
| Open with DEXTER | |
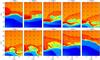 |
Fig. A.6
Zoom-in of the density distribution by colour for the case with clump parameters χ = 10 and Rc = 5 a for the times shown at the top of each plot. The remaining plot properties are the same as those of Fig. A.1. |
| Open with DEXTER | |
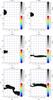 |
Fig. A.7
Tracer distribution by colour for the case with clump parameters χ = 10 and Rc = 5 a for the times shown at the top of each plot. The tracer value ranges from 0 (pulsar and stellar wind) to 1 (clump). The remaining plot properties are the same as those of Fig. A.1. |
| Open with DEXTER | |
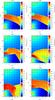 |
Fig. A.8
Pressure distribution in units of ρ0c2 by colour for the case with clump parameters χ = 10 and Rc = 5 a for the times shown at the top of each plot. The remaining plot properties are the same as those of Fig. A.1. |
| Open with DEXTER | |
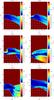 |
Fig. A.9
Momentum flux over pressure distribution by colour for the case with clump parameters χ = 10 and Rc = 5 a for the times shown at the top of each plot. The momentum flux is given by Fp = ρ Γ2v2(1 + ϵ + P/ρ) + P. The remaining plot properties are the same as those of Fig. A.1. |
| Open with DEXTER | |
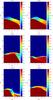 |
Fig. A.10
β distribution by colour for the case with clump parameters χ = 10 and Rc = 5 a for the times shown at the top of each plot. The remaining plot properties are the same as those of Fig. A.1. |
| Open with DEXTER | |
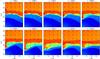 |
Fig. A.11
Zoom-in of the density distribution by colour for the case with clump parameters χ = 30 and Rc = 1 a for the times shown at the top of each plot. The remaining plot properties are the same as those of Fig. A.1. |
| Open with DEXTER | |
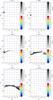 |
Fig. A.12
Tracer distribution by colour for the case with clump parameters χ = 30 and Rc = 1 a for the times shown at the top of each plot. The tracer value ranges from 0 (pulsar and stellar wind) to 1 (clump). The remaining plot properties are the same as those of Fig. A.1. |
| Open with DEXTER | |
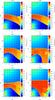 |
Fig. A.13
Pressure distribution in units of ρ0c2 by colour for the case with clump parameters χ = 30 and Rc = 1 a for the times shown at the top of each plot. The remaining plot properties are the same as those of Fig. A.1. |
| Open with DEXTER | |
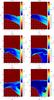 |
Fig. A.14
Momentum flux over pressure distribution by colour for the case with clump parameters χ = 30 and Rc = 1 a for the times shown at the top of each plot. The momentum flux is given by Fp = ρ Γ2v2(1 + ϵ + P/ρ) + P. The remaining plot properties are the same as those of Fig. A.1. |
| Open with DEXTER | |
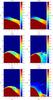 |
Fig. A.15
β distribution by colour for the case with clump parameters χ = 30 and Rc = 1 a for the times shown at the top of each plot. The remaining plot properties are the same as those of Fig. A.1. |
| Open with DEXTER | |
© ESO, 2015
Current usage metrics show cumulative count of Article Views (full-text article views including HTML views, PDF and ePub downloads, according to the available data) and Abstracts Views on Vision4Press platform.
Data correspond to usage on the plateform after 2015. The current usage metrics is available 48-96 hours after online publication and is updated daily on week days.
Initial download of the metrics may take a while.