Free Access
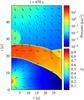
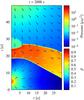
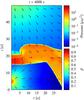
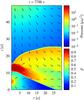
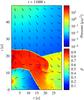
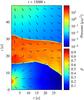
Fig. A.8

Pressure distribution in units of ρ0c2 by colour for the case with clump parameters χ = 10 and Rc = 5 a for the times shown at the top of each plot. The remaining plot properties are the same as those of Fig. A.1.
This figure is made of several images, please see below:
Current usage metrics show cumulative count of Article Views (full-text article views including HTML views, PDF and ePub downloads, according to the available data) and Abstracts Views on Vision4Press platform.
Data correspond to usage on the plateform after 2015. The current usage metrics is available 48-96 hours after online publication and is updated daily on week days.
Initial download of the metrics may take a while.