Fig. A.1
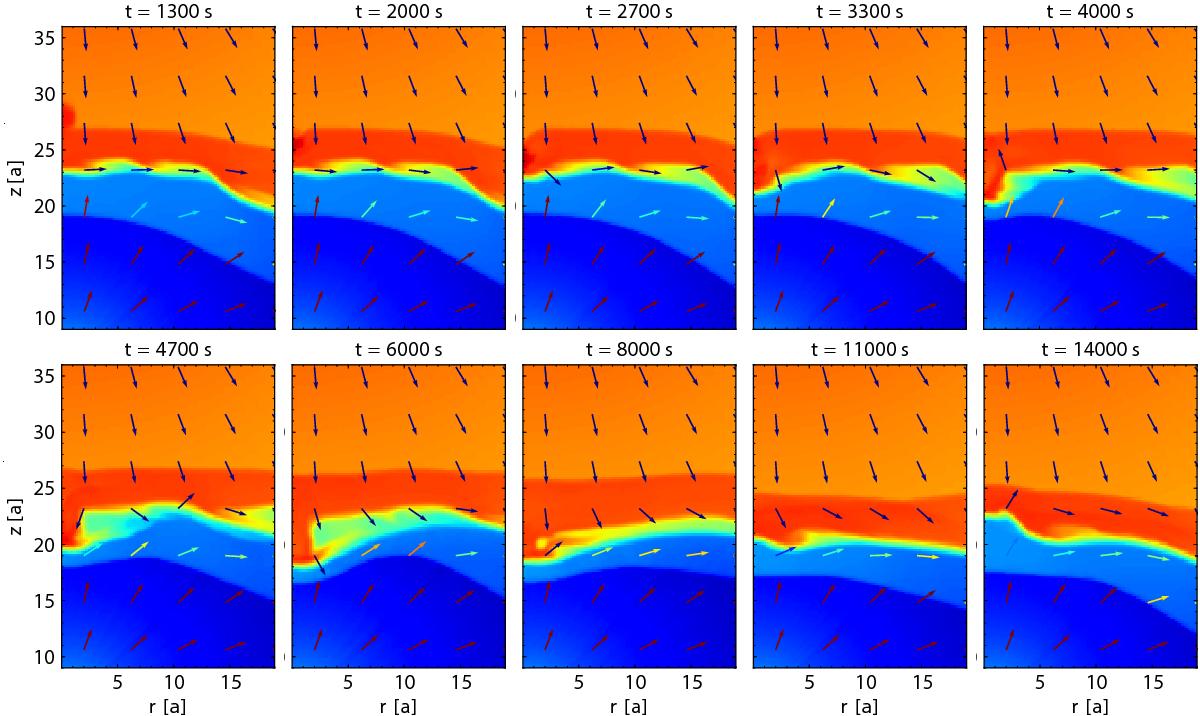
Zoom-in of the density distribution by colour for the case with clump parameters χ = 10 and Rc = 1 a for the times shown at the top of each plot. The coloured arrows represent the three-velocity at different locations (β = v/c). The axes units are a = 8 × 1010 cm. The pulsar and the star are located at (r,z) = (0,5 a) and (r,z) = (0,60 a), respectively.
Current usage metrics show cumulative count of Article Views (full-text article views including HTML views, PDF and ePub downloads, according to the available data) and Abstracts Views on Vision4Press platform.
Data correspond to usage on the plateform after 2015. The current usage metrics is available 48-96 hours after online publication and is updated daily on week days.
Initial download of the metrics may take a while.