| Issue |
A&A
Volume 574, February 2015
|
|
|---|---|---|
| Article Number | A13 | |
| Number of page(s) | 40 | |
| Section | Galactic structure, stellar clusters and populations | |
| DOI | https://doi.org/10.1051/0004-6361/201424414 | |
| Published online | 16 January 2015 | |
Online material
Spectral classifications and radial velocities for B-type stars in the VFTS.
Appendix A: Ancillary material
Appendix A.1: Spectral montages
To illustrate the spectral sequences as a function of luminosity class, examples of VFTS B-type spectra are shown in Figs. A.1−A.3. The principal lines used in classification, as summarised in Tables 1 and 2 are indicated in each figure. Luminosity sequences at spectral types B0.2, B1 and B2.5 are shown in Figs. A.4−A.6, respectively. For clarity, the spectra in all six figures have been smoothed and rebinned to an effective resolving power of R = 4000.
Appendix A.2: Detailed velocity estimates
For completeness, we list the individual velocity estimates from each line, calculated using the rest wavelengths given in Table 3. Tables A.1 and A.2 present the results for stars using the Set 1 and Set 2 diagnostic lines, respectively; results for the binary stars (following the discussion outlined in Sect. 4.2) are given in Table A.3.
Appendix A.2.1: Comparison with published velocity estimates
The methods and line sets adopted to estimate radial velocities (vr) for the B-type stars differ to those employed by Sana et al. (2013) for the O-type objects from the survey. As a consistency check between the two studies, we analysed 45 of the apparently-single, late O-type stars (with O9.5 and O9.7 types) and compared our velocity estimates with those from Sana et al. We find a mean and standard deviation between the two methods of Δv = 0.5 ± 6.2 kms-1 (where Δv = vr − vSana).
The differential results (Δv) for the 45 stars are shown in Fig. A.7 (with the standard deviations added in quadrature). For the purposes of global analysis of the sample and identification of potential runaways, these results are in excellent agreement. As a further check of any systematic trends arising from the different methods, the lower panel of Fig. A.7 shows the same differential velocities, but now as a function of estimated vesini (from Dufton et al. 2013); no obvious systematic difference is present.
Appendix A.3: Centre-of-mass velocities
We have investigated the expected differences between our mean values and centre-of-mass velocities using a Monte Carlo technique. We assumed a sinusoidal velocity curve (i.e. circular orbit) and, adopting the observational sampling of Field A of the survey (Table A.1 of Paper I), we calculated ranges of observed velocities (i.e. δvr max) and their resulting mean velocity. We assumed a random initial phase, and considered periods ranging from one day up to several years.
These simulated mean velocities provide us with an estimate of the expected error compared to the genuine centre-of-mass velocity. For a given period, we can then average these differences over the range of assumed phases to find a typical error. The ratio of this typical error to δvr max is shown in Fig. A.8. For binaries with periods of ≲250 d, the expected error is approximately 12−15 % of δvr max, with this increasing for longer periods, and then tending to a value of ~25% for periods ≳350 d (greater than the maximum time-sampling of the real data).
These simplistic simulations (e.g. not taking into account potential eccentric orbits) have probably underestimated the uncertainties but, given the observational cadence of the survey, they illustrate that the mean multi-epoch vr values should provide reasonable estimates of the centre-of-mass velocities for short-period systems (≲250 d), which display relatively small peak-to-peak variations.
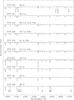 |
Fig. A.1
Example B-type supergiants (Class Ia). The primary diagnostic lines for spectral classification are identified. In the spectrum of VFTS 525 these are: He II λλ4542, 4686; Si III λλ4553-68-74; Si IV λλ4089, 4116; those identified in VFTS 269 are: He I λλ4009, 4026, 4121, 4144, 4388, 4471, 4713; Mg II λ4481; Si II λλ4128-32. The broad λ4428 diffuse interstellar band is also evident in some sightlines. |
| Open with DEXTER | |
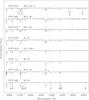 |
Fig. A.2
Example B-type giants (Class III). The identified lines are the same as those in Fig. A.1; nebular lines have been truncated in VFTS 335 as indicated. |
| Open with DEXTER | |
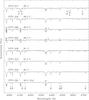 |
Fig. A.3
Example B-type dwarfs (Class V). The identified lines are the same as those in Fig. A.1; nebular lines have been truncated in three spectra as indicated. |
| Open with DEXTER | |
|
Fig. A.4
Example luminosity sequence at B0.2. The identified lines are the same as those in Fig. A.1; we note the greater intensity of the metallic lines with increasing luminosity (including the C III + O II features at ~λ4650). |
|
| Open with DEXTER | |
|
Fig. A.5
Example luminosity sequence at B1. The identified He and Si lines are the same as those in Fig. A.1. |
|
| Open with DEXTER | |
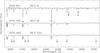 |
Fig. A.6
Example luminosity sequence at B2.5. The identified He and Si lines are the same as those in Fig. A.1 and the nebular lines have been truncated in VFTS 335 as indicated. |
| Open with DEXTER | |
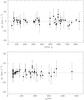 |
Fig. A.7
Comparison of radial velocities (vr) estimated using the methods in this paper with results from Sana et al. (2013), in which Δv = vr − vSana, and the plotted uncertainties are the standard deviations of both estimates added in quadrature. The upper panel shows the Δv results in the sequence of VFTS identifiers (i.e. increasing right ascension), while the lower panel shows Δv as a function of vesini. |
| Open with DEXTER | |
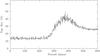 |
Fig. A.8
Typical errors in the average radial velocities (calculated for the observational sampling of Field A of the VFTS) for simulated binaries compared to their true centre-of-mass velocities (as a percentage of the expected range in radial velocities, δvrmax, see text for details). |
| Open with DEXTER | |
Line-by-line radial-velocity estimates for single stars using the Set 1 absorption lines.
Line-by-line radial-velocity estimates for single stars using the Set 2 absorption lines.
Line-by-line radial-velocity estimates for single-lined binaries using absorption lines in the LR02 observations.
© ESO, 2015
Current usage metrics show cumulative count of Article Views (full-text article views including HTML views, PDF and ePub downloads, according to the available data) and Abstracts Views on Vision4Press platform.
Data correspond to usage on the plateform after 2015. The current usage metrics is available 48-96 hours after online publication and is updated daily on week days.
Initial download of the metrics may take a while.