Fig. A.7
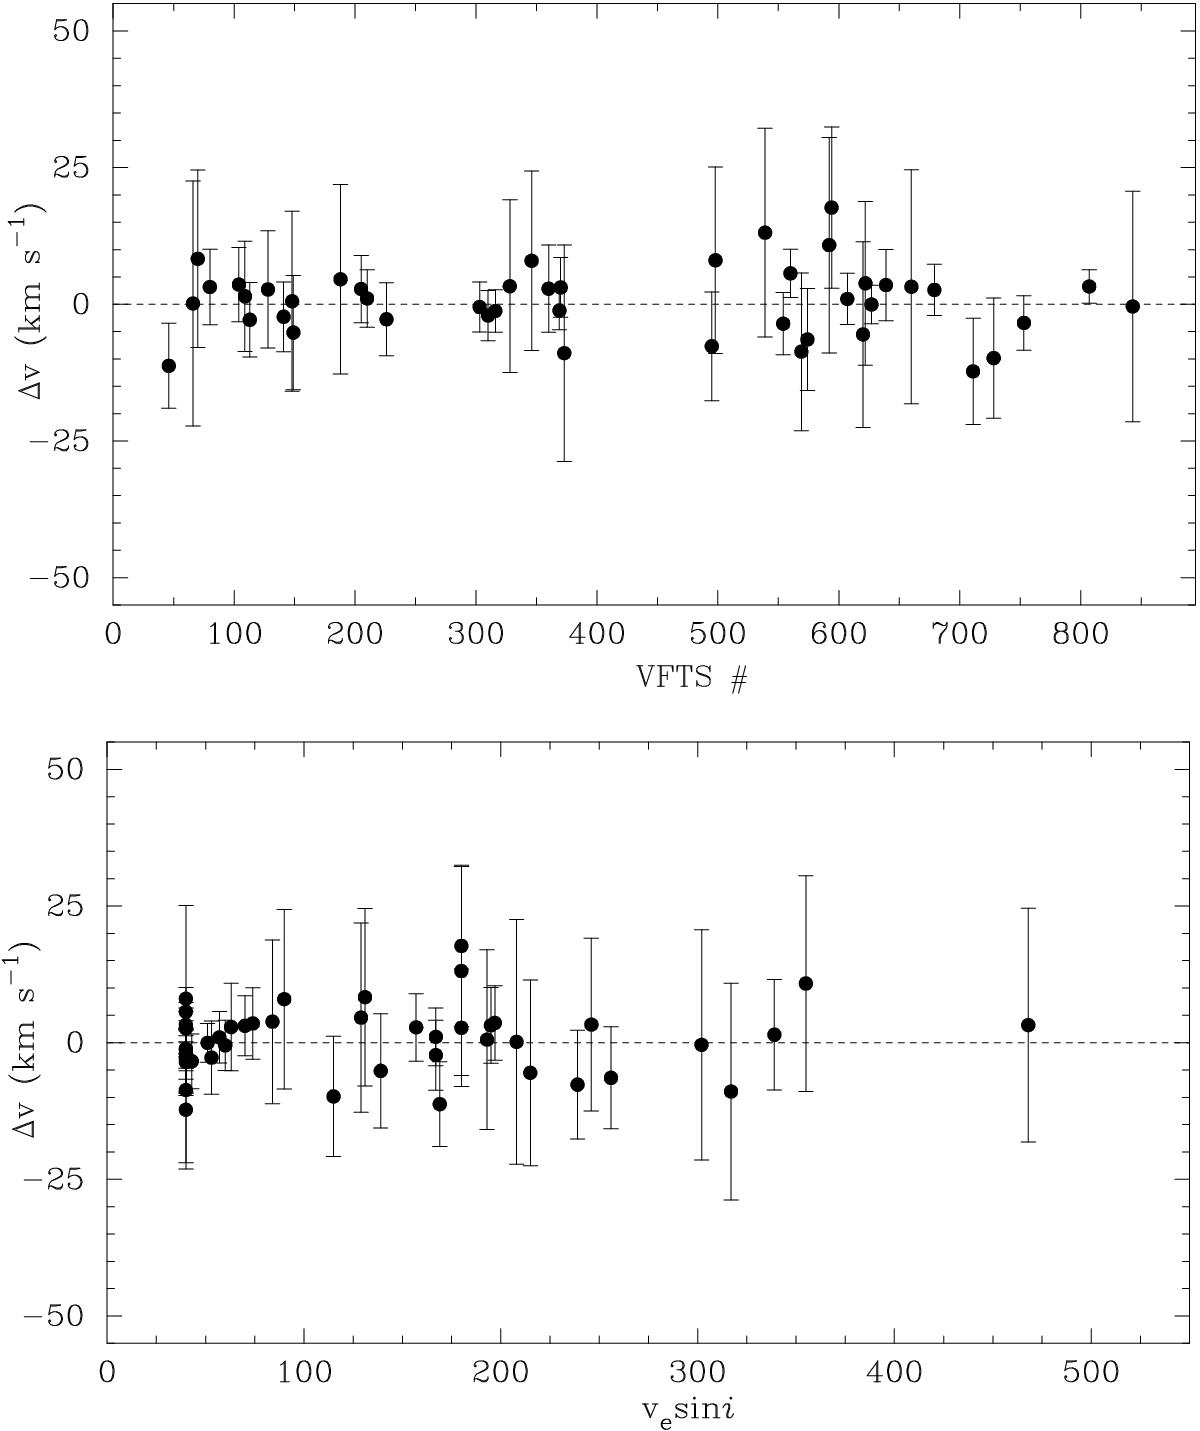
Comparison of radial velocities (vr) estimated using the methods in this paper with results from Sana et al. (2013), in which Δv = vr − vSana, and the plotted uncertainties are the standard deviations of both estimates added in quadrature. The upper panel shows the Δv results in the sequence of VFTS identifiers (i.e. increasing right ascension), while the lower panel shows Δv as a function of vesini.
Current usage metrics show cumulative count of Article Views (full-text article views including HTML views, PDF and ePub downloads, according to the available data) and Abstracts Views on Vision4Press platform.
Data correspond to usage on the plateform after 2015. The current usage metrics is available 48-96 hours after online publication and is updated daily on week days.
Initial download of the metrics may take a while.