| Issue |
A&A
Volume 573, January 2015
|
|
|---|---|---|
| Article Number | A76 | |
| Number of page(s) | 24 | |
| Section | Extragalactic astronomy | |
| DOI | https://doi.org/10.1051/0004-6361/201424694 | |
| Published online | 22 December 2014 | |
Online material
Flux densities of our whole sample.
Summary of the properties of our whole sample.
Pearson’s r and Spearman’s ρ flux density correlations and their p-values for the whole sample and the subsamples.
| log FR – log FIR | log FR – log FX | |||
| Sample | Pearson’s r (p) | Spearman’s ρ (p) | r (p) | ρ (p) |
|
|
||||
| all | –0.055 (0.360) | –0.017 (0.782) | 0.047 (0.624) | 0.130 (0.179) |
| RQ | 0.548 (~10-8) | 0.571 (~10-9) | 0.251 (0.053) | 0.333 (0.010) |
| RL | 0.131 (0.071) | 0.142 (0.049) | 0.213 (0.141) | 0.255 (0.077) |
| VRL | 0.181 (0.202) | 0.289 (0.039) | 0.229 (0.394) | 0.159 (0.556) |
| SRL | 0.687 (0.028) | 0.418 (0.232) | –0.205 (0.795) | 0.200 (0.917) |
Notes.Correlations in boldface have p< 0.05.
Linear fits of the flux densities for the radio-quiet and radio-loud subsamples.
Linear fits of the luminosities for the radio-quiet and radio-loud subsamples.
MBH – luminosity correlations for the whole sample and the subsamples.
FWHM(Hβ) – luminosity correlations for the whole sample and the subsamples.
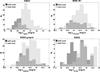 |
Fig. 2
Luminosity distributions of the radio-quiet and radio-loud subsamples for the wavebands for which we present the correlation results; FIRST, WISE W1-band, SDSS g-band and RASS. |
| Open with DEXTER | |
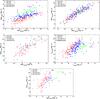 |
Fig. 4
Luminosity dependencies between the wavebands we used to compute the correlations. Subsamples are shown with different symbols and colors; radio-quiet: filled red stars, radio-loud: open blue circles, very radio-loud: filled green circles, and super radio-loud: filled purple squares. |
| Open with DEXTER | |
|
Fig. 5
Dependency between the Eddington ratio and eigenvectors 1 and 2 from the PCA with seven variables. Radio-loud and radio-quiet subsamples are shown with different symbols and colors; radio-quiet: filled red stars, and radio-loud: open blue circles. |
|
| Open with DEXTER | |
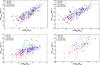 |
Fig. 7
Dependencies between the black hole mass and luminosities. Subsamples are shown with different symbols and colors; radio-quiet: filled red stars, radio-loud: open blue circles, very radio-loud: filled green circles, and super radio-loud: filled purple squares. |
| Open with DEXTER | |
© ESO, 2014
Current usage metrics show cumulative count of Article Views (full-text article views including HTML views, PDF and ePub downloads, according to the available data) and Abstracts Views on Vision4Press platform.
Data correspond to usage on the plateform after 2015. The current usage metrics is available 48-96 hours after online publication and is updated daily on week days.
Initial download of the metrics may take a while.