| Issue |
A&A
Volume 573, January 2015
|
|
|---|---|---|
| Article Number | A76 | |
| Number of page(s) | 24 | |
| Section | Extragalactic astronomy | |
| DOI | https://doi.org/10.1051/0004-6361/201424694 | |
| Published online | 22 December 2014 | |
Statistical multifrequency study of narrow-line Seyfert 1 galaxies⋆
1
Aalto University Metsähovi Radio Observatory,
Metsähovintie 114,
02540
Kylmälä,
Finland
e-mail:
This email address is being protected from spambots. You need JavaScript enabled to view it.
2
Aalto University Department of Radio Science and
Engineering, 13000,
00076
Aalto,
Finland
3
Instituto Nacional de Astrofísica Óptica y Electrónica
(INAOE), Apartado Postal 51 y
216, 72000
Puebla,
Mexico
4
Finnish Centre for Astronomy with ESO (FINCA), University of
Turku, Väisäläntie
20, 21500
Piikkiö,
Finland
Received: 28 July 2014
Accepted: 2 October 2014
Abstract
Context. High-energy γ-rays, which are produced by powerful relativistic jets, are usually associated with blazars and radio galaxies. In the current active galactic nuclei (AGN) paradigm, such jets are almost exclusively launched from massive elliptical galaxies. Recently, however, Fermi/LAT detected γ-rays from a few narrow-line Seyfert 1 galaxies and thus confirmed the presence of relativistic jets in them. Since NLS1 galaxies are assumed to be young evolving AGN, they offer a unique opportunity to study the production of relativistic jets in late-type galaxies.
Aims. Our aim is to estimate by which processes the emission of various kinds is produced in NLS1 galaxies and to study how emission properties are connected to other intrinsic AGN properties.
Methods. We have compiled the so far largest multiwavelength database of NLS1 sources. This allowed us to explore correlations between different wavebands and source properties using, for example, Pearson and Spearman correlations and principal component analysis. We did this separately for radio-loud and radio-quiet sources.
Results. Multiwavelength correlations suggest that radio-loud sources host relativistic jets that are the predominant sources of radio, optical, and X-ray emission. The origin of infrared emission remains unclear. Radio-quiet sources do not host a jet, or the jet is very weak. In them, radio and infrared emission is more likely generated via star formation processes, and the optical and X-ray emission originate in the inner parts of the AGN. We also find that the black hole mass correlates significantly with radio loudness, which suggests that NLS1 galaxies with more massive black holes are more likely to be able to launch powerful relativistic jets.
Key words: galaxies: active / galaxies: Seyfert / galaxies: statistics / X-rays: galaxies
Tables 1, 2, 5, 7, 8, 12, 13 and Figs. 2, 4, 5, 7 are available in electronic form at http://www.aanda.org
© ESO, 2014
1. Introduction
Narrow-line Seyfert 1 galaxies (NLS1) are a subclass of Seyfert galaxies first described in 1985 by Osterbrock & Pogge (1985). They are mostly hosted by spiral galaxies; however, a few of them are found in peculiar, interacting, or E/S0 systems (Ohta et al. 2007). Optical studies suggest that the disk-like host galaxies of NLS1 galaxies are more often barred (85 ± 7%) than are the disk-like hosts of broad-line Seyfert 1 galaxies (BLS1) (40–70%) (Ohta et al. 2007).
NLS1 galaxies are believed to be rather young active galactic nuclei (AGN) in the early stages of their evolution (Mathur et al. 2001). They harbor low- or intermediate-mass black holes (MBH< 108 M⊙) (Peterson et al. 2000) accreting at high rates (0.1–1 Eddington rate or even above) (Boroson & Green 1992) and tend to lie below the normal MBH-σ∗ (stellar velocity dispersion of the bulge) and MBH-Lbulge (luminosity of the bulge) relations (Mathur et al. 2001), suggesting that they are still evolving. Radio-quiet NLS1 galaxies also show enhanced star formation (Sani et al. 2010).
In NLS1 galaxies permitted emission lines are narrow, making them of comparable width with narrow forbidden lines. Characterizing spectral features are FWHM(Hβ) < 2000 km s-1 (Goodrich 1989) and [O III]/Hβ< 3 (with exceptions allowed if there are strong [Fe VIII] and [Fe X] present) (Osterbrock & Pogge 1985). Some but not all NLS1 sources show strong Fe II emission (Osterbrock & Pogge 1985).
NLS1 sources show a strong soft X-ray excess, and some of them also exhibit very rapid, high-amplitude variability at X-rays. Overall they have more diverse soft X-ray (0.1–2.5 keV) photon indices (Γ ≈ 1–5) than Type 1 Seyfert galaxies (Γ ≈ 2) (Boller et al. 1996). There is a relation between FWHM(Hβ) and the X-ray spectral slope αX. Sources with narrower Hβ tend to have steeper X-ray spectra (Puchnarewicz et al. 1992; Boller et al. 1996).
NLS1 sources are generally radio-quiet, but studies have shown that ~7% of them are radio-loud (Komossa et al. 2006). However, they generally have a very compact radio morphology; evidence of large scale structures has been found only in six NLS1 sources (Gliozzi et al. 2010; Doi et al. 2012). All of these sources are radio-loud and have on average more massive black holes than the NLS1 population in general. Five of six sources have MBH> 107 M⊙ (Doi et al. 2012).
The spectral energy distributions (SEDs) of some radio-loud NLS1 sources are similar to the SEDs of blazars. In them the most prominent features are two broad components, one extending from radio to soft X-rays and the other covering hard X-rays and γ-rays. The first bump is believed to be due to synchrotron emission and the second bump due to inverse-Compton (IC) scattering.
Although some NLS1 galaxies show blazar-like behavior, no γ-ray emission was expected due to their host galaxy type. That changed in 2008 when the Large Area Telescope1 onboard Fermi Gamma-ray Space Telescope2 detected γ-ray emission from the source PMN J0948+0022 identified as a NLS1 galaxy (Abdo et al. 2009a). Consequently two multiwavelength campaigns were launched to better understand its nature. During the first campaign (March-July 2009) it was confirmed that the γ-ray emission is indeed associated with the known radio-loud NLS1 PMN J0948+0022 (Abdo et al. 2009b; Yuan et al. 2008). Later, during the second multiwavelength campaign (July-September 2010) it flared at γ-rays and reached the extreme power of ~1048 erg s-1 in the 0.1–100 GeV band (Foschini et al. 2011).
So far five NLS1 sources have been detected with high significance at γ-rays confirming that they are a new class of γ-ray emitting AGN, in addition to blazars and radio galaxies. The discovery of γ-ray emission from NLS1 galaxies was remarkable because in the current AGN paradigm powerful relativistic jets are almost exclusively launched from massive elliptical galaxies with supermassive black holes (Urry 2003). Blazars and radio galaxies, and NLS1 galaxies have different hosts (late-type in NLS1 galaxies, however, see León-Tavares et al. 2014), MBH (smaller in NLS1 galaxies), accretion rates (higher in NLS1 galaxies), and radio morphologies (compact in NLS1 galaxies). Yet we now know that NLS1 galaxies can form and launch a fully developed relativistic jet. This poses many interesting questions concerning AGN and relativistic jet evolution, and challenges our current knowledge of jet systems. Therefore, NLS1 galaxies offer a great opportunity to study the evolution of relativistic jets and further our understanding about the mechanisms that drive AGN activity.
In this study our aim is to estimate via which processes and, if possible, where the various kinds of emission are produced in NLS1 galaxies. We address this issue by compiling multiwavelength observations from literature for a large sample of NLS1 sources. This allows us to explore correlations between different wavebands, and identify the most likely radiation mechanism responsible for the bulk of the energy released in NLS1 sources. We are also interested in how the emission properties are connected with other intrinsic AGN properties, for example, the black hole mass.
Throughout the paper we assume a cosmology with H0 = 73 km s-1 Mpc-1, Ωmatter = 0.27 and Ωvacuum = 0.73.
2. Sample selection
Our sample was selected using three references: Zhou et al. (2006), Yuan et al. (2008), and Komossa et al. (2006). The original sample in Zhou et al. (2006) consists of 2011 NLS1 sources selected from Sloan Digital Sky Survey3 (SDSS) Data Release 3 with restrictions z ≲ 0.8 and the “broad” component of Hβ or Hα narrower than 2200 km s-1 at the 10 σ or higher confidence level. From this sample, using ASI Science Data Center’s (ASDC4) Sky Explorer and SED Builder, we selected sources which had radio data from the Very Large Array (VLA) Faint Images of the Radio Sky at Twenty-Centimeters (FIRST5) survey. This makes a total of 280 sources which we included in our sample.
The sample in Yuan et al. (2008) consists of 23 radio-loud NLS1 sources selected from SDSS Data Release 5 under the same restrictions as in Zhou et al. (2006). 12 of them overlap with the Zhou et al. (2006) sample; we included the remaining 11 new sources to our sample.
Our third reference Komossa et al. (2006) has a sample of 11 radio-loud NLS1 sources found by cross-correlating the Catalogue of Quasars and Active Nuclei (Veron-Cetty & Veron 2003) with several radio and optical catalogs using the cross-matcher application developed within the German Astrophysical Virtual Observatory (GAVO)6 project. The sample was limited by the requirement Hβ< 2000 km s-1. From Komossa et al. (2006) we were able to include only one source to our sample since some of them overlapped sources from Zhou et al. (2006) and Yuan et al. (2008), and some of them did not have radio data. Our final sample consists of 292 NLS1 galaxies.
All the data for our sample were gathered from publicly available archival sources, and it should be noted that they are therefore not simultaneous. Studying correlations between wavebands of variable sources, such as AGN, should ideally be performed with data that are no more than a couple of weeks apart, but in practise this is often impossible. Radio data from FIRST, optical data from SDSS, and X-ray data from ROSAT7 All Sky Survey (RASS) were retrieved from ASDC. We have radio and optical data for all of our sources, and X-ray data for 109 sources (hereafter called the X-ray sample). Data obtained from ASDC were already corrected for galactic extinction.
Infrared data from Wide-field Infrared Survey Explorer (WISE8) All-Sky Source Catalog9 (Cutri & et al. 2012) were retrieved from the NASA/IPAC Infrared Science Archive (IRSA10). We used a search radius of 2 4 (Massaro et al. 2011) and a minimum signal-to-noise ratio >7 in at least one band. We found a match for 291 sources. Nine sources were excluded from the sample due to the contamination risk11, thus we have infrared data for 282 sources. Infrared data are not corrected for the galactic absorption because the correction would be smaller than the uncertainties in magnitudes. Flux densities (in Janskys) were computed using the WISE magnitudes12.
Sample sizes at different wavebands, mean redshifts and their standard deviations (std), and mean black hole masses and their standard deviations for the whole sample and the subsamples.
Additional W4-band correction suggested by the WISE Explanatory Supplement was done for “red” sources with α> 1 (α being power-law index: Fν ∝ ν− α). α was estimated using [W1 − W2] and [W2 − W3] colors and a table in Wright et al. (2010). Corrections were computed with the equation: Fν[ W4 ] = 0.9 × Fν [W4]. Flux densities for all of our sources are listed in Table 1.
Luminosities for all wavebands were computed from the equation 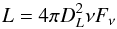 (1)where DL is the luminosity distance to the source and Fν flux density in Janskys. DL values were obtained from the NASA/IPAC Extragalactic Database13 (NED).
3. Data analysis
3.1. Radio-loudness
We computed radio loudness (RL) for all of our sources. We used the commonly defined RL value; the ratio of 1.4 GHz radio flux density (FR) and 440 nm optical flux density (FO). For FR we used the K-corrected (we did K-correction as suggested in Foschini 2011) radio flux density from the FIRST survey and for FO the K-corrected B-band optical flux density calculated using SDSS u- and g-band magnitudes14,15. The radio loudness values for our sources are listed in Table 2.
We then divided the sources to four subsamples by their radio loudness. The subsamples are: radio-quiet (RQ; RL < 10, 97 sources), radio-loud (RL; RL > 10, 195 sources), very radio-loud (VRL; RL > 100, 51 sources), and super radio-loud (SRL; RL > 1000, 10 sources). The radio-loud subsample includes very radio-loud and super radio-loud subsamples. The subsamples and their sizes by waveband are presented in Table 3.
3.2. Parent population
We used the two-sample Kolmogorov-Smirnov test (hereafter K-S test) with 5% significance level (probability value p< 0.05) in order to examine whether the parent population of our radio-quiet and radio-loud subsamples is the same.
Mean redshifts and standard deviations for the different subsamples are given in Table 3. The K-S test for redshift suggests that our radio-quiet and radio-loud subsamples are not originally from the same distribution (p = 1.42 × 10⁻⁴). The distributions are shown in Fig. 1. In our sample, radio-quiet sources tend to lie closer than radio-loud sources.
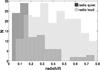 |
Fig. 1 Redshift distributions of the radio-quiet and radio-loud subsamples. |
The K-S test also suggests that radio-quiet and radio-loud subsamples are not drawn from the same luminosity distribution. P-values for the K-S test are small, from 0.013 to ~10-26. Radio-loud sources are on average more luminous than radio-quiet sources. This holds for all wavebands. Examples of radio-loud and radio-quiet luminosity distributions are shown in Fig. 2.
3.2.1. Black hole mass estimation
There are three methods commonly used to estimate the black hole mass (MBH) in AGN. These methods make use of the stellar velocity dispersion of the bulges (σ∗), the mass of the bulge (Mbulge, Bentz et al. 2009), and FWHM(Hβ) or FWHM(Hα). We calculated MBH estimations using the FWHM(Hβ) – luminosity mass scaling relation (see Greene & Ho 2005, for more details) 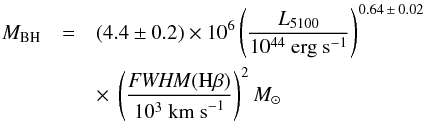 (2)where L5100 is the monochromatic luminosity at 5100 Å. L5100 and FWHM(Hβ) values were taken from Zhou et al. (2006). We used this method because there is no comprehensive enough information about σ∗ or Lbulge for our sources. However, it does not take into account possible inclination effects caused by the geometry of the broad-line region (BLR) of the source and the viewing angle (Decarli et al. 2011). NLS1 sources also tend to lie below the normal MBH-σ∗ and MBH-Lbulge relations (Mathur et al. 2001; Laor 2001).
We were able to estimate the MBH for 275 sources. The mean values and standard deviations are shown in Table 3, and the black hole mass estimates for individual sources are listed in Table 2.
The K-S test for MBH suggests that the radio-quiet and radio-loud subsamples are not drawn from the same distribution (p = 2.04 × 10⁻⁴). On average radio-loud sources have more massive black holes than radio-quiet sources. McLure & Jarvis (2004) got similar results for a large sample of quasars (6099 radio-quiet and 436 radio-loud sources). The MBH distributions of the radio-loud and radio-quiet subsamples are shown in Fig. 3.
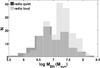 |
Fig. 3 Black hole mass distribution of the radio-quiet and radio-loud subsamples. |
3.3. Multiwavelength correlations
Results of multiwavelength correlations in literature are diverse and especially for NLS1 sources also very sparse. Arshakian et al. (2010) found LR,total-LO correlation for a sample of ~100 quasars, and LR,jet-LO correlation for BL Lac objects (~18). Ballo et al. (2012) concluded that in a sample of 852 quasars and 14 Seyfert galaxies there is LR-LX correlation but no LO-LX correlation, whereas Brinkmann et al. (2000) found a correlation for both in a mixed sample. LR-LX correlation has also been found in several other studies (Younes et al. (2012) for six LINER 1 sources, Panessa et al. (2007) for 47 Seyfert galaxies and 33 low-luminosity radio galaxies, Bianchi et al. (2009) for 156 radio-quiet X-ray unobscured AGN). Connection between radio and gamma-ray emission in radio-loud AGN has been confirmed by, for example, Jorstad et al. (2001), Lähteenmäki & Valtaoja (2003) and Nieppola et al. (2011), and between mm and submm and gamma-ray emission by León-Tavares et al. (2012).
We used Pearson product-moment correlation coefficient (Pearson’s r), Spearman’s rank correlation coefficient (Spearman’s ρ) and Pearson and Spearman partial correlation coefficients to study how the different wavebands are connected. The correlation is significant and the null hypothesis rejected if p< 0.05.
We computed correlations for the flux densities for the whole sample and for all the subsamples individually. The correlations are shown in Table 4 and the most significant results are shown in Table 5. The flux densities used to calculate the results presented in Table 5 are the optical and radio flux densities used to calculate the radio-loudness, WISE W1 infrared flux density, and RASS X-ray flux density. We used SDSS g-band because it is closest to B-band which we used to calculate the radio-loudness. All the infrared and optical bands had very similar correlation results, therefore we present correlations for just one infrared and one optical band.
The same correlations were computed also for luminosities, and in addition we determined the Pearson’s r and Spearman’s ρ partial correlation coefficients for all the correlations shown in Table 4. For luminosities the used wavebands are FIRST, SDSS g-band, WISE W1-band, and RASS. The results are again presented for one infrared and one optical band due to the similarity of the results in all bands. For partial correlations we used redshift as the third parameter to rule out the possibility that the possible correlation is not real but caused by redshift. The main results for partial correlations are shown in Table 6 and L-L plots in Fig. 4. All other calculated multiwavelength correlations, e.g., the other optical and infrared wavebands, all luminosity correlations, and correlations for the X-ray selected samples did not differ significantly from the results presented here so they are omitted.
In addition to flux density and luminosity correlations we studied correlations MBH-RL, MBH-L (Table 12), and FWHM(Hβ)-L (Table 13). They are discussed in more detail in Sects. 3.5, 3.6, and 3.7.
In order to get more insight into whether the origin of the emission at certain wavebands is the same in our radio-quiet and radio-loud subsamples, we computed linear fits (y = ax + b) for flux densities and luminosities between different wavebands by using the least squares method. Totally distinct slopes would suggest a different origin. Results for the fits for flux densities are shown in Table 7 and for luminosities in Table 8.
The multiwavelength correlations and linear fits are discussed in the next section.
Flux density and luminosity correlations between the different wavebands.
Pearson’s r and Spearman’s ρ partial luminosity correlations and their p-values for the whole sample and the subsamples.
| log LR-log LIR | log LR-log LX | |||
| Sample | Pearson’s r (p) | Spearman’s ρ (p) | r (p) | ρ (p) |
|
|
||||
| All | 0.030 (0.613) | –0.078 (0.192) | 0.151 (0.119) | 0.184 (0.057) |
| RQ | 0.546 (~10-8) | 0.380 (~10-4) | 0.230 (0.079) | 0.314 (0.016) |
| RL | 0.101 (0.163) | 0.018 (0.800) | 0.201 (0.171) | 0.277 (0.057) |
| VRL | 0.094 (0.518) | 0.269 (0.059) | 0.218 (0.436) | 0.310 (0.261) |
| SRL | 0.676 (0.048) | 0.806 (0.009) | 0.171 (0.890) | N/A (N/A) |
Notes.Correlations in boldface have p< 0.05.
3.3.1. Radio-loud and radio-quiet sources
The results for flux density, luminosity, and partial luminosity correlations were similar.
In the radio-loud subsample the optical band correlates rather well with the infrared (all subsamples) and X-ray (RL sample as a whole but not for VRL and SRL subsamples separately) bands. The correlation between the optical and radio bands becomes obvious only when looking at the VRL and SRL subsamples. This suggests that in radio-loud sources radio, optical, and at least partially also X-ray emission come mostly from the jet as the jet emits low-energy synchrotron radiation (radio emission) and high-energy IC emission (X-ray emission). However, a portion of the X-ray emission might also originate in the hot corona of the accretion disk via IC. Similarly, optical emission is supposedly composed of non-thermal emission from the jet and thermal emission from the accretion disk. Radio and infrared emission do not correlate (except for the SRL subsample which, however, is very small and therefore the correlation cannot be considered convincing) which might indicate that infrared emission is rather of thermal than non-thermal origin, for example, from the dusty torus (reprocessed emission from the accretion disk) or from star formation (reradiated starlight) (Bressan et al. 2006). Radio emission does not correlate with X-rays either. This is probably due to the very high and rapid X-ray variability exhibited by NLS1 sources (e.g. Leighly 1999; Komossa & Meerschweinchen 2000). X-ray emission is variable in very short time scales, and since we have only one X-ray waveband observation per source, the observed X-ray flux value is highly coincidental. We also do not have any simultaneous radio and X-ray data.
In the radio-quiet subsample the optical band correlates very well with the infrared, and moderately well with radio and X-ray bands. Due to the radio-quietness of these sources it is likely that they do not host a jet or the jet is not powerful enough to dominate the emission. The predominant source of radio emission in the radio-quiet subsample could therefore be supernova remnants (Condon 1992). In fact, radio emission does not correlate too well with the X-ray emission which probably is produced in the hot corona of the accretion disk via IC. As for the optical emission, it probably comes from the accretion disk. Radio and infrared bands correlate moderately well which suggests that infrared emission is generated by star formation as reradiated starlight (Botticella et al. 2012). However, dust heated by the AGN should also be taken into account when modeling both radio-quiet and radio-loud AGN (Mason et al. 2013).
Linear fits for flux densities and luminosities show very different slopes for the radio-quiet and radio-loud subsamples. For example, SIR-SR slope for the radio-quiet subsample is 0.759, whereas for the radio-loud it is 0.070. Corresponding slopes for luminosities are 0.754 and 0.373. This suggests that the infrared emission mechanism is different for the radio-quiet and radio-loud sources.
3.4. Principal component and cluster analysis
Principal component analysis (PCA) is a statistical method used to simplify large amounts of data. It converts a set of possibly correlated variables into a set of uncorrelated variables called principal components, or eigenvectors. The first principal component accounts for as much of the variability in the data as possible. The second principal component has as large a variance as possible while still being orthogonal to the first principal component, and so on. This method makes it possible to find underlying connections and the most dominant variables in a data set, and possibly helps to identify the physical properties connected with each eigenvector. A good overview of the PCA in astronomy can be found in Francis & Wills (1999).
Boroson & Green (1992) used PCA to study the optical properties of 87 quasi-stellar objects (QSO). In their study eigenvector 1 (EV1) is dominated by the anticorrelation between the strength of Fe II, and the strength of [OIII] λ5007 and FWHM(Hβ), and eigenvector 2 (EV2) distinguishes between the strength of He II λ4686 and optical luminosity. This study was continued in Boroson (2002) where 75 sources were added to the original sample. The results for the first two principal components were similar to the earlier study. They suggest that EV1 corresponds closely to the Eddington ratio, L/LEdd, and EV2 to the accretion rate. Xu et al. (2012) studied a sample of narrow-line and broad-line Seyfert 1 galaxies using PCA. Their results were consistent with Boroson & Green (1992) and Boroson (2002). In a study of 110 soft X-ray -selected AGN, of which about half were NLS1 galaxies, Grupe (2004) found the EV1 to be similar to the EV1 in Boroson (2002). EV2 in their study correlated strongly with the black hole mass.
We performed weighted principal component analysis (PCA) using the pca16 function in MATLAB Statistics Toolbox for the whole sample (97 sources), the radio-loud subsample (41 sources), the radio-quiet subsample (56 sources), and the corresponding modified samples (super radio-loud outlier, SDSS J104732.68+472532.1, removed). We carried out PCA with seven variables for all samples. The variables used were the radio flux density (FIRST), infrared flux density (WISE W1-band), optical flux density (SDSS g-band), X-ray flux density (RASS), MBH, FWHM(Hβ) (Hβ broad component FWHM), and R4570 (optical Fe II strength relative to broad Hβ component). We included R4570 to the PCA because it is possibly related to the radio emission. For example, Yuan et al. (2008) found that the optical Fe II emission is on average stronger for radio-loud NLS1 sources than for the NLS1 population in general. Values for FWHM(Hβ) and R4570 were taken from Zhou et al. (2006). To start with, we tried several combinations of variables and, for example, correlated MBH, in the cases when it was left out of the PCA, with the eigenvectors along the lines of Xu et al. (2012) and Grupe (2004). Unfortunately, most of these experiments did not yield any convincing results so instead we changed the focus of the analysis to how the different properties are linked to each other, and therefore decided to include MBH in the PCA. This proved to be a more informative approach.
Results only for the first and the second principal components are presented because the results for the subsequent components were mixed and no conclusions could be drawn from them. The PCA coefficients are listed in Tables 9 and 10. In the tables, the coefficients have been grouped together based on their sign, i.e. whether they correlate or anticorrelate with the eigenvector. In this way, it is easier to see which properties might be linked to each other.
We also tried cluster analysis for our whole sample in order to see if there are any distinguishable groups within our sample. We tried both hierarchical clustering and k-Means clustering with five variables: radio flux density (FIRST), infrared flux density (WISE W1-band), optical flux density (SDSS g-band), X-ray flux density (RASS), and MBH. Cluster analysis did not yield any compelling results.
Results of the principal component analysis with seven variables, eigenvector 1.
Results of the principal component analysis with seven variables, eigenvector 2.
3.4.1. Eigenvector 1
EV1 accounts for 34%–37% of the variance. In all samples and subsamples EV1 distinguishes between MBH and both optical and infrared emissions. The latter two are always connected. X-ray emission behaves similarly to infrared and optical but contributes less. Radio emission is rather insignificant except in the radio-quiet subsample where it is connected with optical and infrared, confirming the suggestion that in the radio-quiet sources radio emission is rather of stellar origin. FWHM(Hβ) is strongly connected with MBH except in the radio-quiet subsample where it is less significant. R4570 is rather insignificant in all samples.
In all cases for EV1 the optical and infrared wavebands seem to be tightly connected, and opposite to MBH and FWHM(Hβ). In the radio-quiet subsample also radio emission is connected with optical and infrared. In all cases the X-ray band behaves similarly to infrared and optical. These results suggest that optical and infrared emission (and up to some extent X-ray emission) – and in radio-quiet sources also the radio emission – are either of thermal or stellar origin i.e. not generated in a jet. The significance of MBH implies that EV1 might be similar to EV2 in Grupe (2004).
3.4.2. Eigenvector 2
19%–24% of the variance is explained by EV2. It clearly distinguishes between R4570 and FWHM(Hβ) in all samples. To some extent also infrared and optical seem to be connected to FWHM(Hβ). Since EV2 is dominated by the anticorrelation of R4570 and FWHM(Hβ) it is similar to EV1 found in Boroson & Green (1992), Boroson (2002) and Xu et al. (2012).
3.4.3. Eddington ratio and eigenvector interpretation
In order to get more insight into the connection between the eigenvectors and the physical properties of our sources, we calculated the Spearman rank correlation coefficients between the eigenvectors and the Eddington ratio (Lbol/LEdd). To compute the Eddington ratio we used the estimations Lbol = 9λL5100 (Kaspi et al. 2000) and LEdd = 1.3 × 1038MBH/ M⊙ (Xu et al. 2012). Logarithmic mean, minimum, and maximum values for the Eddington ratio are − 0.13, − 0.75 and 0.48, respectively. The correlation results are shown in Table 11 and Fig. 5.
EV2 strongly correlates with the Eddington ratio, and the correlation seems to be slightly better for the radio-loud samples. Similarly, Xu et al. (2012) found a correlation between their EV1 and the Eddington ratio. We also tried PCA with five variables – without FWHM(Hβ) and R4570 – and interestingly found no correlation between EV2 and Eddington ratio. I t seems that the connection is generated by FWHM(Hβ) and R4570. This is supported by the results that FWHM(Hβ) and R4570 correlate strongly with Eddington ratio. For FWHM(Hβ) – Lbol/LEdd correlation ρ = −0.71 (p = ~10-16), and for R4570 – Lbol/LEdd correlation ρ = 0.63 (p = ~10-12). A weak correlation between EV1 and the Eddington ratio exists only for the radio-quiet sample.
As Grupe (2004) also points out, each sample has its own eigenvectors that depend on the parameters used and their range. In the earlier studies mixed samples, or samples not including NLS1 galaxies at all, have been used whereas we have looked at a pure NLS1 sample. Particularly in Boroson (2002) and Xu et al. (2012) the distribution of NLS1 galaxies, and also other pure samples containing just one source type, with respect to the two eigenvectors seems rather different from the distribution of the whole sample; distribution along EV2 is emphasized in the NLS1 group. This might indicate that the properties that appear in EV1 of the mixed samples, emerge in EV2 of pure samples. This could, for example, be interpreted as a sequence of properties that change from one source type to another thus creating the EV1 in mixed samples, and which is transformed to a sequence of properties within a pure sample of just one source type but in a less significant role (EV2 of our NLS1 sample). EV1 of our NLS1 sample would then describe those properties that cause most of the differences within that source type only. We also tested our analysis by performing it with optical data only, as has been done in the earlier studies, in case our additional data at other wavelengths or the black hole mass might influence the result. Variables used were the SDSS g-band flux density, λL5100 Å, F(Hβ), FWHM(Hβ), F([OIII]) and R4570. The values for additional optical variables were taken from Zhou et al. (2006). This, however, did not change our results.
Spearman rank correlations and probability values (in parentheses) for eigenvectors 1 and 2 from PCA with seven variables, and log L/LEdd for all samples.
3.5. MBH – radio-loudness correlations
Whether the correlation MBH-RL in AGN really exists has been widely studied. The results are contradictory. Some studies suggest that the correlation exists (e.g., Laor 2000; Lacy et al. 2001; McLure & Jarvis 2004; Metcalf & Magliocchetti 2006; Chiaberge & Marconi 2011; Castignani et al. 2013) whereas others conclude that there is no correlation (Oshlack et al. 2002; Woo & Urry 2002b) or the correlation at least is not clear (Ho 2002; Woo & Urry 2002a). In a study of 47 NLS1 galaxies Whalen et al. (2006) found an anticorrelation between MBH and RL.
We found that the black hole mass and the radio-loudness weakly correlate for the whole sample with Pearson’s r = 0.244 (p = ~10-5) and Spearman’s ρ = 0.212 (p = ~10-4). This indicates that NLS1 galaxies with more massive black holes are more likely to be able to lauch powerful relativistic jets and are therefore louder at radio frequencies.
Komossa et al. (2006) noticed that in the Laor diagram (MBH-RL, Laor 2000) NLS1 galaxies are located in a region formerly very sparsely populated with sources with rather small black hole masses (given their radio-loudness) compared to other AGN. We constructed a Laor diagram of our whole sample (Fig. 6). Most of our sources also lie outside the formerly populated regions shown in Fig. 4 in Komossa et al. (2006).
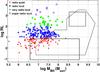 |
Fig. 6 Dependence of radio-loudness on black hole mass. Formerly populated regions from Komossa et al. (2006) shown with solid and dashed lines. Subsamples are shown with different symbols and colors; radio-quiet: filled red stars, radio-loud: open blue circles, very radio-loud: filled green circles, and super radio-loud: open purple squares. |
3.6. MBH – luminosity correlations
Several previous studies have not shown MBH-LR correlation in AGN (e.g., Ho 2002; Woo & Urry 2002a; Oshlack et al. 2002; Snellen et al. 2003; Woo et al. 2005; León-Tavares et al. 2011; Park et al. 2013). Woo et al. (2005) also studied the MBH-LX correlation (particularly in BL Lac objects) and did not find any support for it. In a study of radio-loud quasars Metcalf & Magliocchetti (2006) found no clear MBH-LR correlation but they did find a strong MBH-LO correlation. A large number of studies find a correlation between MBH and LR (e.g., McLure et al. 1999; Lacy et al. 2001; Dunlop et al. 2003; McLure & Jarvis 2004; Bianchi et al. 2009). Bianchi et al. (2009) also found correlation between MBH and LX.
We calculated the correlations using the FIRST, SDSS g-band, WISE W1-band, and RASS luminosities. The results are presented in Table 12 and MBH-L plots in Fig. 7. MBH and luminosities at all wavebands correlate well for the whole sample and all subsamples; the correlation is strongest between MBH and LO, and MBH and LIR. This suggests that the more massive the black hole the more powerful the AGN. In radio-loud NLS1 sources, where most of the emission supposedly comes from the jet, this suggests that more massive black holes have more powerful jets. In radio-quiet sources, if radio emission comes from supernova remnants and infrared emission from star formation, it is harder to explain why MBH correlates with LR and LIR.
3.7. FWHM(Hβ) – luminosity correlations
The wavebands used were the same as before. The results for the FWHM(Hβ)-L correlations for the whole sample and the subsamples are presented in Table 13. FWHM(Hβ) and luminosities in general correlate, although relatively weakly, for the whole sample and subsamples. Exception to this is the X-ray waveband which does not correlate with FWHM(Hβ). Also there does not seem to be any correlation among the very radio-loud and super radio-loud subsamples. This might be due to the very limited sizes of these samples. For the whole sample the strongest correlation is for FWHM(Hβ)-LO.
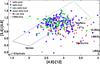 |
Fig. 8 WISE color–color diagram of our whole sample. γ-ray strips from Massaro et al. (2012) (BL Lac strip: dark blue dashed line, and FSRQ strip: dark green dashed line) and approximate regions populated by other types of sources are shown. Subsamples are shown with different symbols and colors; radio-quiet: filled red stars, radio-loud: open blue circles, very radio-loud: filled green circles, and super radio-loud: filled purple squares. See text for details. |
3.8. WISE blazar strip
Massaro et al. (2011) showed that WISE colors can be used to differentiate sources dominated by thermal or non-thermal emission on a [3.4]–[4.6]–[12] μm color diagram. Using a large sample of blazars they constructed the WISE γ-ray strip (WGS); a region populated by sources dominated by non-thermal emission. WGS makes it possible to identify new γ-ray emitters based on their WISE colors. We made use of this identification tool and constructed the WISE color diagram for our sources and for the whole Zhou et al. (2006) sample. We used the parametrizations presented in Massaro et al. (2012). They provided parameters for two partly overlapping strips; one for BL Lac objects and another for flat spectrum radio quasars (FSRQs).
The WISE color diagram constructed for our sample, WGS, and approximate regions populated by other types of sources (ultra luminous infrared galaxies, ULIRGs; luminous infrared galaxies, LIRGs; low-ionization nuclear emission-line region galaxies, LINERs) are shown in Fig. 8. 72.7% of all, 57.8% of radio-quiet and 79.7% of radio-loud sources are located inside the WGS. The properties (e.g., radio-loudness, flux densities, luminosities, and MBH) for these sources are average compared to the whole sample. This suggests that infrared emission is of non-thermal origin and that most of our sources should host a jet. Some of our results are contradictory to this (see Sect. 4). We expected that the difference between radio-quiet and radio-loud sources would be bigger since radio-loud sources should host a jet whereas radio-quiet should not. The reason for so many radio-quiet sources lying inside the WGS is unclear, but there are a few possible explanations. It might be that for some, yet unclear reason WGS does not apply for NLS1 galaxies. This might be due to the enhanced star formation in the circumnuclear regions of NLS1 galaxies because the star formation process is “boosting” the infrared colors. Another possibility is that these sources really host a jet, but it is not powerful enough to dominate the whole electromagnetic spectrum.
1348 out of 1943 WISE detected sources from Zhou et al. (2006) lie inside the WGS. This is nearly the same percentage (69.4%) as in our sample which indicates that our sample represents the whole sample well.
4. Discussion
On the origin of infrared emission. Linear slope fitting suggests that infrared emission from radio-quiet and radio-loud sources has a different origin, supposedly thermal in radio-quiet and non-thermal in radio-loud sources. Multiwavelength correlations indicate that infrared emission in radio-quiet sources might be thermal whereas WGS indicates that it is non-thermal. The WGS also suggests that the origin in radio-loud sources is non-thermal. On the other hand the multiwavelength correlation results for radio-loud sources suggest that infrared emission is of thermal origin. Principal component analysis suggests that the origin of the infrared emission in both radio-loud and radio-quiet sources is of thermal origin. Thus the source, or sources, of the infrared emission in NLS1 galaxies remains unclear. It is possible that non-thermal, reradiated (from torus), and star forming processes all contribute to the infrared emission. More infrared observations of large NLS1 samples are needed in order to study the origins of the infrared emission in more detail.
Parent population. The results for the K-S test for luminosities, redshift, and black hole masses indicate that the parent population for the radio-loud and radio-quiet NLS1 sources is different. Still they have many similar properties, for example, the optical spectrum, which suggests that they are from the same or from very similar parent populations. To get an insight into the differences between the radio-loud and radio-quiet populations, a proper characterization of the host galaxies of radio-loud and radio-quiet sources is needed to see whether the differences might be related to the host galaxy type. Differences in black hole masses between the radio-quiet and radio-loud sources might also suggest an evolutionary line.
In our sample, radio-quiet sources tend to lie closer than radio-loud sources. This may also be related to AGN evolution; AGN were more numerous and luminous in the past. AGNs with more massive black holes – and thus higher luminosities – evolved first and were highly active in the past. They evolved to be less luminous or entirely quiescent sources, e.g., normal non-active galaxies. Low-luminosity sources with lower mass black holes emerged later and are much more numerous in the present Universe (Beckmann & Shrader 2012). Also the significant z-RL correlation (Pearson’s r = 0.474, p = ~10-18 and Spearman’s ρ = 0.497, p = ~10-19) supports these results; radio-quiet sources tend to lie closer than radio-loud.
In the current unification models differences between Type 1 and 2 Seyfert galaxies are explained with orientation and obscuration effects. In these models, Seyfert 1 galaxies are viewed pole-on, unobstructed, while Seyfert 2 galaxies are viewed edge-on through obscuring matter in the accretion disk (e.g. Miller & Antonucci 1983 and Antonucci 1993). However, evidence against the simple unification model of Seyfert 1 and 2 galaxies has lately accumulated. Several studies have shown that approximately 50% of Seyfert 2 galaxies do not show a hidden broad-line region (HBLR) in their polarized optical spectra. This suggests that not all Seyfert 2 galaxies harbor a nucleus similar to Seyfert 1 galaxies. It seems that non-HBLR Seyfert 2 galaxies accommodate weaker nuclei that do not exhibit typical BLRs. HBLR and non-HBLR Seyfert 2 galaxies have also other differences such as luminosity and accretion rate (e.g., Tran 2001, 2003; Wu et al. 2011; Marinucci et al. 2012; Yu et al. 2013). Zhang & Wang (2006) studied NLS1 and non-HBLR Seyfert 2 galaxies, and suggested that they can be unified based on orientation; non-HBLR Seyfert 2 galaxies are NLS1 galaxies viewed edge-on. This result is, however, debatable since the sources have many unexplained differences, for example, non-HBLR Seyfert 2 galaxies do not show Fe II emission lines (Yu et al. 2013). Furthermore, Decarli et al. (2008) studied the properties of NLS1 and BLS1 galaxies. They showed that when assuming a disk-like BLR and pole-on orientation of NLS1 galaxies, some of the observed differences between NLS1 and BLS1 galaxies can be explained.
AGN unification models are currently under constant revision; the question how NLS1 galaxies fit in remains open.
5. Summary
In this study the aim was to further our understanding about Narrow-Line Seyfert 1 galaxies, which are a new class of γ-ray emitting AGN. We addressed this issue by studying emission processes and properties of NLS1 galaxies, and also studied how these properties are connected with other AGN properties. To this end, we have compiled the largest multiwavelength database of NLS1 galaxies so far. This data set should be useful in the future as it permits easy identification and comparison of properties of new γ-ray NLS1 sources to be detected by Fermi or other facilities.
The main results of this study are:
-
1.
The distributions of radio-quiet and radio-loud NLS1 galaxiesin redshift, luminosity, and black hole mass are different. Radio-quiet sources also tend to lie closer than radio-loud sources.
-
2.
NLS1 sources with more massive black holes are more likely to be able to lauch a powerful relativistic jet.
-
3.
Multiwavelength correlations suggest that radio-loud sources host a jet which is the predominant sources of the radio, optical, and at least partially also X-ray emission. The origin of the infrared emission remains unclear.
-
4.
Radio-quiet sources do not host a jet or the jet is very weak. Radio and infrared emission are more likely to originate from star formation processes, and optical and X-ray emission from the inner parts of the AGN.
While the results of this study mainly confirm what is already known of NLS1 galaxies, they also serve as a comprehensive starting point for further studies, for example, at high radio and infrared frequencies where the information so far is scarce. Open questions in need of more investigation include, for example, the origin of the infrared emission in NLS1 galaxies and the differences between radio-quiet and radio-loud sources (i.e. the question of the parent population). Simultaneous multiwavelength observations of especially radio-loud NLS1 sources should be very useful in modeling and understanding their emission properties. Studies of NLS1 galaxies may also provide us with a further look at AGN evolution and activity in general, and the evolution of relativistic jets.
Online material
Flux densities of our whole sample.
Summary of the properties of our whole sample.
Pearson’s r and Spearman’s ρ flux density correlations and their p-values for the whole sample and the subsamples.
| log FR – log FIR | log FR – log FX | |||
| Sample | Pearson’s r (p) | Spearman’s ρ (p) | r (p) | ρ (p) |
|
|
||||
| all | –0.055 (0.360) | –0.017 (0.782) | 0.047 (0.624) | 0.130 (0.179) |
| RQ | 0.548 (~10-8) | 0.571 (~10-9) | 0.251 (0.053) | 0.333 (0.010) |
| RL | 0.131 (0.071) | 0.142 (0.049) | 0.213 (0.141) | 0.255 (0.077) |
| VRL | 0.181 (0.202) | 0.289 (0.039) | 0.229 (0.394) | 0.159 (0.556) |
| SRL | 0.687 (0.028) | 0.418 (0.232) | –0.205 (0.795) | 0.200 (0.917) |
Notes.Correlations in boldface have p< 0.05.
Linear fits of the flux densities for the radio-quiet and radio-loud subsamples.
Linear fits of the luminosities for the radio-quiet and radio-loud subsamples.
MBH – luminosity correlations for the whole sample and the subsamples.
FWHM(Hβ) – luminosity correlations for the whole sample and the subsamples.
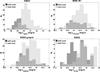 |
Fig. 2 Luminosity distributions of the radio-quiet and radio-loud subsamples for the wavebands for which we present the correlation results; FIRST, WISE W1-band, SDSS g-band and RASS. |
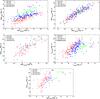 |
Fig. 4 Luminosity dependencies between the wavebands we used to compute the correlations. Subsamples are shown with different symbols and colors; radio-quiet: filled red stars, radio-loud: open blue circles, very radio-loud: filled green circles, and super radio-loud: filled purple squares. |
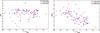 |
Fig. 5 Dependency between the Eddington ratio and eigenvectors 1 and 2 from the PCA with seven variables. Radio-loud and radio-quiet subsamples are shown with different symbols and colors; radio-quiet: filled red stars, and radio-loud: open blue circles. |
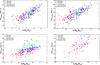 |
Fig. 7 Dependencies between the black hole mass and luminosities. Subsamples are shown with different symbols and colors; radio-quiet: filled red stars, radio-loud: open blue circles, very radio-loud: filled green circles, and super radio-loud: filled purple squares. |
For sources with non-zero cc_flags -column it is adviced in the WISE Explanatory Supplement that the observation should be ignored because one or more bands might be somehow contaminated.
Acknowledgments
We are grateful to K. I. I. Koljonen for his help with PCA. This research has made use of the NASA/IPAC Extragalactic Database (NED) which is operated by the Jet Propulsion Laboratory, California Institute of Technology, under contract with the National Aeronautics and Space Administration. The National Radio Astronomy Observatory is a facility of the National Science Foundation operated under cooperative agreement by Associated Universities, Inc. This publication makes use of data products from the Wide-field Infrared Survey Explorer, which is a joint project of the University of California, Los Angeles, and the Jet Propulsion Laboratory/California Institute of Technology, funded by the National Aeronautics and Space Administration. Funding for the Sloan Digital Sky Survey (SDSS) has been provided by the Alfred P. Sloan Foundation, the Participating Institutions, the National Aeronautics and Space Administration, the National Science Foundation, the US Department of Energy, the Japanese Monbukagakusho, and the Max Planck Society. The SDSS web site is http://www.sdss.org/. The SDSS is managed by the Astrophysical Research Consortium (ARC) for the Participating Institutions. The Participating Institutions are The University of Chicago, Fermilab, the Institute for Advanced Study, the Japan Participation Group, The Johns Hopkins University, the Korean Scientist Group, Los Alamos National Laboratory, the Max-Planck-Institute for Astronomy (MPIA), the Max-Planck-Institute for Astrophysics (MPA), New Mexico State University, University of Pittsburgh, University of Portsmouth, Princeton University, the United States Naval Observatory, and the University of Washington. This research has made use of the ROSAT All-Sky Survey data which have been processed at MPE.
References
- Abdo, A. A., Ackermann, M., Ajello, M., et al. 2009a, ApJ, 699, 976 [NASA ADS] [CrossRef] [Google Scholar]
- Abdo, A. A., Ackermann, M., Ajello, M., et al. 2009b, ApJ, 707, 727 [NASA ADS] [CrossRef] [Google Scholar]
- Antonucci, R. 1993, ARA&A, 31, 473 [Google Scholar]
- Arshakian, T. G., Torrealba, J., Chavushyan, V. H., et al. 2010, A&A, 520, A62 [NASA ADS] [CrossRef] [EDP Sciences] [Google Scholar]
- Ballo, L., Heras, F. J. H., Barcons, X., & Carrera, F. J. 2012, A&A, 545, A66 [NASA ADS] [CrossRef] [EDP Sciences] [Google Scholar]
- Beckmann, V., & Shrader, C. R. 2012, Active Galactic Nuclei (Wiley-VCH Verlag GmbH & Co) [Google Scholar]
- Bentz, M. C., Peterson, B. M., Pogge, R. W., & Vestergaard, M. 2009, ApJ, 694, L166 [NASA ADS] [CrossRef] [Google Scholar]
- Bianchi, S., Bonilla, N. F., Guainazzi, M., Matt, G., & Ponti, G. 2009, A&A, 501, 915 [NASA ADS] [CrossRef] [EDP Sciences] [Google Scholar]
- Boller, T., Brandt, W. N., & Fink, H. 1996, A&A, 305, 53 [NASA ADS] [Google Scholar]
- Boroson, T. A. 2002, ApJ, 565, 78 [NASA ADS] [CrossRef] [Google Scholar]
- Boroson, T. A., & Green, R. F. 1992, ApJS, 80, 109 [NASA ADS] [CrossRef] [Google Scholar]
- Botticella, M. T., Smartt, S. J., Kennicutt, R. C., et al. 2012, A&A, 537, A132 [NASA ADS] [CrossRef] [EDP Sciences] [Google Scholar]
- Bressan, A., Panuzzo, P., Buson, L., et al. 2006, ApJ, 639, L55 [NASA ADS] [CrossRef] [Google Scholar]
- Brinkmann, W., Laurent-Muehleisen, S. A., Voges, W., et al. 2000, A&A, 356, 445 [NASA ADS] [Google Scholar]
- Castignani, G., Haardt, F., Lapi, A., et al. 2013, A&A, 560, A28 [NASA ADS] [CrossRef] [EDP Sciences] [Google Scholar]
- Chiaberge, M., & Marconi, A. 2011, MNRAS, 416, 917 [NASA ADS] [CrossRef] [Google Scholar]
- Condon, J. J. 1992, ARA&A, 30, 575 [NASA ADS] [CrossRef] [MathSciNet] [Google Scholar]
- Cutri, R. M., et al. 2012, VizieR Online Data Catalog: II/311 [Google Scholar]
- Decarli, R., Dotti, M., Fontana, M., & Haardt, F. 2008, MNRAS, 386, L15 [NASA ADS] [Google Scholar]
- Decarli, R., Dotti, M., & Treves, A. 2011, MNRAS, 413, 39 [NASA ADS] [CrossRef] [Google Scholar]
- Doi, A., Nagira, H., Kawakatu, N., et al. 2012, ApJ, 760, 41 [NASA ADS] [CrossRef] [Google Scholar]
- Dunlop, J. S., McLure, R. J., Kukula, M. J., et al. 2003, MNRAS, 340, 1095 [NASA ADS] [CrossRef] [Google Scholar]
- Foschini, L. 2011, in Narrow-Line Seyfert 1 Galaxies and their Place in the Universe, Milano, PoS(NLS1)24 [Google Scholar]
- Foschini, L., Ghisellini, G., Kovalev, Y. Y., et al. 2011, MNRAS, 413, 1671 [NASA ADS] [CrossRef] [Google Scholar]
- Francis, P. J., & Wills, B. J. 1999, in Quasars and Cosmology, eds. G. Ferland, & J. Baldwin, ASP Conf. Ser., 162, 363 [Google Scholar]
- Gliozzi, M., Papadakis, I. E., Grupe, D., et al. 2010, ApJ, 717, 1243 [NASA ADS] [CrossRef] [Google Scholar]
- Goodrich, R. W. 1989, ApJ, 342, 224 [NASA ADS] [CrossRef] [Google Scholar]
- Greene, J. E., & Ho, L. C. 2005, ApJ, 630, 122 [NASA ADS] [CrossRef] [Google Scholar]
- Grupe, D. 2004, AJ, 127, 1799 [NASA ADS] [CrossRef] [Google Scholar]
- Ho, L. C. 2002, ApJ, 564, 120 [NASA ADS] [CrossRef] [Google Scholar]
- Jorstad, S. G., Marscher, A. P., Mattox, J. R., et al. 2001, ApJ, 556, 738 [NASA ADS] [CrossRef] [Google Scholar]
- Kaspi, S., Smith, P. S., Netzer, H., et al. 2000, ApJ, 533, 631 [NASA ADS] [CrossRef] [Google Scholar]
- Komossa, S., & Meerschweinchen, J. 2000, A&A, 354, 411 [NASA ADS] [Google Scholar]
- Komossa, S., Voges, W., Xu, D., et al. 2006, AJ, 132, 531 [NASA ADS] [CrossRef] [Google Scholar]
- Lacy, M., Laurent-Muehleisen, S. A., Ridgway, S. E., Becker, R. H., & White, R. L. 2001, ApJ, 551, L17 [NASA ADS] [CrossRef] [Google Scholar]
- Lähteenmäki, A., & Valtaoja, E. 2003, ApJ, 590, 95 [NASA ADS] [CrossRef] [Google Scholar]
- Laor, A. 2000, ApJ, 543, L111 [NASA ADS] [CrossRef] [Google Scholar]
- Laor, A. 2001, ApJ, 553, 677 [NASA ADS] [CrossRef] [Google Scholar]
- Leighly, K. M. 1999, ApJS, 125, 297 [NASA ADS] [CrossRef] [Google Scholar]
- León-Tavares, J., Valtaoja, E., Chavushyan, V. H., et al. 2011, MNRAS, 411, 1127 [NASA ADS] [CrossRef] [Google Scholar]
- León-Tavares, J., Valtaoja, E., Giommi, P., et al. 2012, ApJ, 754, 23 [NASA ADS] [CrossRef] [Google Scholar]
- León Tavares, J., Kotilainen, J., Chavushyan, V., et al. 2014, ApJ, 795, 58 [NASA ADS] [CrossRef] [Google Scholar]
- Marinucci, A., Bianchi, S., Nicastro, F., Matt, G., & Goulding, A. D. 2012, ApJ, 748, 130 [NASA ADS] [CrossRef] [Google Scholar]
- Mason, R. E., Ramos Almeida, C., Levenson, N. A., Nemmen, R., & Alonso-Herrero, A. 2013, ApJ, 777, 164 [NASA ADS] [CrossRef] [Google Scholar]
- Massaro, F., D’Abrusco, R., Ajello, M., Grindlay, J. E., & Smith, H. A. 2011, ApJ, 740, L48 [NASA ADS] [CrossRef] [Google Scholar]
- Massaro, F., D’Abrusco, R., Tosti, G., et al. 2012, ApJ, 750, 138 [NASA ADS] [CrossRef] [Google Scholar]
- Mathur, S., Kuraszkiewicz, J., & Czerny, B. 2001, New A, 6, 321 [Google Scholar]
- McLure, R. J., & Jarvis, M. J. 2004, MNRAS, 353, L45 [NASA ADS] [CrossRef] [Google Scholar]
- McLure, R. J., Kukula, M. J., Dunlop, J. S., et al. 1999, MNRAS, 308, 377 [CrossRef] [Google Scholar]
- Metcalf, R. B., & Magliocchetti, M. 2006, MNRAS, 365, 101 [NASA ADS] [CrossRef] [Google Scholar]
- Miller, J. S., & Antonucci, R. R. J. 1983, ApJ, 271, L7 [NASA ADS] [CrossRef] [Google Scholar]
- Nieppola, E., Tornikoski, M., Valtaoja, E., et al. 2011, A&A, 535, A69 [NASA ADS] [CrossRef] [EDP Sciences] [Google Scholar]
- Ohta, K., Aoki, K., Kawaguchi, T., & Kiuchi, G. 2007, ApJS, 169, 1 [NASA ADS] [CrossRef] [Google Scholar]
- Oshlack, A. Y. K. N., Webster, R. L., & Whiting, M. T. 2002, ApJ, 576, 81 [NASA ADS] [CrossRef] [Google Scholar]
- Osterbrock, D. E., & Pogge, R. W. 1985, ApJ, 297, 166 [NASA ADS] [CrossRef] [Google Scholar]
- Panessa, F., Barcons, X., Bassani, L., et al. 2007, A&A, 467, 519 [NASA ADS] [CrossRef] [EDP Sciences] [Google Scholar]
- Park, S., Sohn, B. W., & Yi, S. K. 2013, A&A, 560, A80 [NASA ADS] [CrossRef] [EDP Sciences] [Google Scholar]
- Peterson, B. M., McHardy, I. M., Wilkes, B. J., et al. 2000, ApJ, 542, 161 [NASA ADS] [CrossRef] [Google Scholar]
- Puchnarewicz, E. M., Mason, K. O., Cordova, F. A., et al. 1992, MNRAS, 256, 589 [NASA ADS] [CrossRef] [Google Scholar]
- Sani, E., Lutz, D., Risaliti, G., et al. 2010, MNRAS, 403, 1246 [NASA ADS] [CrossRef] [Google Scholar]
- Snellen, I. A. G., Lehnert, M. D., Bremer, M. N., & Schilizzi, R. T. 2003, MNRAS, 342, 889 [NASA ADS] [CrossRef] [Google Scholar]
- Tran, H. D. 2001, ApJ, 554, L19 [NASA ADS] [CrossRef] [Google Scholar]
- Tran, H. D. 2003, ApJ, 583, 632 [NASA ADS] [CrossRef] [Google Scholar]
- Urry, M. 2003, in Active Galactic Nuclei: From Central Engine to Host Galaxy, eds. S. Collin, F. Combes, & I. Shlosman, ASP Conf. Ser., 290, 3 [Google Scholar]
- Veron-Cetty, M. P., & Veron, P. 2003, VizieR Online Data Catalog: VII/235 [Google Scholar]
- Whalen, D. J., Laurent-Muehleisen, S. A., Moran, E. C., & Becker, R. H. 2006, AJ, 131, 1948 [NASA ADS] [CrossRef] [Google Scholar]
- Woo, J.-H., & Urry, C. M. 2002a, ApJ, 579, 530 [NASA ADS] [CrossRef] [Google Scholar]
- Woo, J.-H., & Urry, C. M. 2002b, ApJ, 581, L5 [NASA ADS] [CrossRef] [Google Scholar]
- Woo, J.-H., Urry, C. M., van der Marel, R. P., Lira, P., & Maza, J. 2005, ApJ, 631, 762 [NASA ADS] [CrossRef] [Google Scholar]
- Wright, E. L., Eisenhardt, P. R. M., Mainzer, A. K., et al. 2010, AJ, 140, 1868 [NASA ADS] [CrossRef] [Google Scholar]
- Wu, Y.-Z., Zhang, E.-P., Liang, Y.-C., Zhang, C.-M., & Zhao, Y.-H. 2011, ApJ, 730, 121 [NASA ADS] [CrossRef] [Google Scholar]
- Xu, D., Komossa, S., Zhou, H., et al. 2012, AJ, 143, 83 [NASA ADS] [CrossRef] [Google Scholar]
- Younes, G., Porquet, D., Sabra, B., Reeves, J. N., & Grosso, N. 2012, A&A, 539, A104 [NASA ADS] [CrossRef] [EDP Sciences] [Google Scholar]
- Yu, P.-C., Huang, K.-Y., Hwang, C.-Y., & Ohyama, Y. 2013, ApJ, 768, 30 [NASA ADS] [CrossRef] [Google Scholar]
- Yuan, W., Zhou, H. Y., Komossa, S., et al. 2008, ApJ, 685, 801 [NASA ADS] [CrossRef] [Google Scholar]
- Zhang, E.-P., & Wang, J.-M. 2006, ApJ, 653, 137 [NASA ADS] [CrossRef] [Google Scholar]
- Zhou, H., Wang, T., Yuan, W., et al. 2006, ApJS, 166, 128 [NASA ADS] [CrossRef] [Google Scholar]
All Tables
Sample sizes at different wavebands, mean redshifts and their standard deviations (std), and mean black hole masses and their standard deviations for the whole sample and the subsamples.
Pearson’s r and Spearman’s ρ partial luminosity correlations and their p-values for the whole sample and the subsamples.
Results of the principal component analysis with seven variables, eigenvector 2.
Spearman rank correlations and probability values (in parentheses) for eigenvectors 1 and 2 from PCA with seven variables, and log L/LEdd for all samples.
Pearson’s r and Spearman’s ρ flux density correlations and their p-values for the whole sample and the subsamples.
All Figures
|
Fig. 1 Redshift distributions of the radio-quiet and radio-loud subsamples. |
| In the text | |
|
Fig. 3 Black hole mass distribution of the radio-quiet and radio-loud subsamples. |
| In the text | |
|
Fig. 6 Dependence of radio-loudness on black hole mass. Formerly populated regions from Komossa et al. (2006) shown with solid and dashed lines. Subsamples are shown with different symbols and colors; radio-quiet: filled red stars, radio-loud: open blue circles, very radio-loud: filled green circles, and super radio-loud: open purple squares. |
| In the text | |
|
Fig. 8 WISE color–color diagram of our whole sample. γ-ray strips from Massaro et al. (2012) (BL Lac strip: dark blue dashed line, and FSRQ strip: dark green dashed line) and approximate regions populated by other types of sources are shown. Subsamples are shown with different symbols and colors; radio-quiet: filled red stars, radio-loud: open blue circles, very radio-loud: filled green circles, and super radio-loud: filled purple squares. See text for details. |
| In the text | |
|
Fig. 2 Luminosity distributions of the radio-quiet and radio-loud subsamples for the wavebands for which we present the correlation results; FIRST, WISE W1-band, SDSS g-band and RASS. |
| In the text | |
|
Fig. 4 Luminosity dependencies between the wavebands we used to compute the correlations. Subsamples are shown with different symbols and colors; radio-quiet: filled red stars, radio-loud: open blue circles, very radio-loud: filled green circles, and super radio-loud: filled purple squares. |
| In the text | |
|
Fig. 5 Dependency between the Eddington ratio and eigenvectors 1 and 2 from the PCA with seven variables. Radio-loud and radio-quiet subsamples are shown with different symbols and colors; radio-quiet: filled red stars, and radio-loud: open blue circles. |
| In the text | |
|
Fig. 7 Dependencies between the black hole mass and luminosities. Subsamples are shown with different symbols and colors; radio-quiet: filled red stars, radio-loud: open blue circles, very radio-loud: filled green circles, and super radio-loud: filled purple squares. |
| In the text | |
Current usage metrics show cumulative count of Article Views (full-text article views including HTML views, PDF and ePub downloads, according to the available data) and Abstracts Views on Vision4Press platform.
Data correspond to usage on the plateform after 2015. The current usage metrics is available 48-96 hours after online publication and is updated daily on week days.
Initial download of the metrics may take a while.