| Issue |
A&A
Volume 573, January 2015
|
|
|---|---|---|
| Article Number | A30 | |
| Number of page(s) | 25 | |
| Section | Interstellar and circumstellar matter | |
| DOI | https://doi.org/10.1051/0004-6361/201424349 | |
| Published online | 11 December 2014 | |
Online material
Appendix A: Presentation of the Herschel observations
The individual Herschel observations analyzed in this paper are listed in Table A.1.
Summary of observations.
Appendix B: Pointed data and spectral maps towards the individual sources
Appendix B.1: W28A
W28A (G5.89-0.4) is a massive star formation region at a distance of 1.3 kpc (Motogi et al. 2011). The HIFI spectra are shown in Figs. B.1 and B.2. W28A hosts a powerful outflow with prominent velocity wings extending from −40 to 60 km s-1 Gusdorf et al. (in prep.). The foreground gas is associated with the absorption feature at ~20 km s-1 in the [C ii] spectrum, and with the emission line at the same velocity in the [C i] ![]() spectrum. This gas is probably local. The PACS spectral maps data are presented in Fig. B.3.
spectrum. This gas is probably local. The PACS spectral maps data are presented in Fig. B.3.
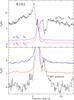 |
Fig. B.1
Top: Herschel/HIFI spectra towards W28A. The red line shows the [C i] |
| Open with DEXTER | |
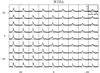 |
Fig. B.2
Montage of [C ii] spectra towards W28A. A baseline has been subtracted from all spectra. The horizontal axis is the LSR velocity in km s-1, which runs from −42 km s-1 to 72 km s-1, and the vertical axis is the antenna temperature in Kelvins, which runs from −1 K to 14 K. The x-axis shows the right ascension offset in arcsec and the y-axis the declination offset in arcsec, relative to the source position given in Table 1. |
| Open with DEXTER | |
|
Fig. B.3
PACS data towards W28A at 158 μm. For all maps, the offsets are given relative to the central position listed in Table 1. Top: continuum emission at 158 μm. Contour levels are 0.2, 0.3, 0.4 ... 0.9 relative to the maximum. Middle: comparison of the integrated absorption measured in the HIFI map relative to the absorption at the map center, with the continuum flux measured in the PACS map relative to the map center. The dashed red line shows the linear regression line and the dotted black line a 1:1 relationship. Bottom: map of the line to continuum emission/absorption in the 25 PACS spaxels. The vertical scale runs from 0.85 to 2.5. The data have not been corrected for the possible contamination in the OFF position. |
|
| Open with DEXTER | |
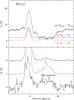 |
Fig. B.4
Top: Herschel/HIFI spectra towards W31C. The red line shows the [C i] |
| Open with DEXTER | |
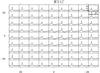 |
Fig. B.5
Montage of [C ii] spectra towards W31C. A baseline has been subtracted from all spectra. The horizontal axis is the LSR velocity in km s-1, which runs from −38 km s-1 to 78 km s-1, and the vertical axis is the antenna temperature in Kelvins, which runs from −7 K to 29 K. The x-axis shows the right ascension offset in arcsec and the y-axis the declination offset in arcsec, relative to the source position given in Table 1. |
| Open with DEXTER | |
Appendix B.2: W31C
W31C(G10.6-0.4) is a massive star forming region located in the Norma arm, at a distance of 5 kpc (Sanna et al. 2014). The foreground material samples the Sagittarius and Scutum-Centaurus arms, in addition to local material. The source velocity is about −2 km s-1 while the foreground material is detected between ~10 and ~50 km s-1. The HIFI spectra are shown in Figs. B.4 and B.5. The PACS spectral maps near 158 μm are presented in Fig. B.6.
Appendix B.3: W33A
W33A(G12.9-0.3) is a highly embedded massive star at a distance of 2.4 kpc (Immer et al. 2013), with a massive cold envelope. A weak absorption from local foreground gas has been detected in CH+ by Godard et al. (2012) but the sensitivity of the present data does not allow us to detect the associated [C ii] feature. The HIFI spectra are shown in Figs. B.7 and B.8. The [C ii] emission from W33A is weak. It is barely detected at the continuum peak but increases as one moves away from the continuum peak. Broad line wings are detected in [C ii], probably associated with a molecular outflow. The [C i] ![]() data show multiple weak emission lines from line of sight diffuse gas, including features located farther away from W33A. The PACS spectral maps near 158 μm are presented in Fig. B.9.
data show multiple weak emission lines from line of sight diffuse gas, including features located farther away from W33A. The PACS spectral maps near 158 μm are presented in Fig. B.9.
Appendix B.4: G34.3+0.15
G34.3+0.15 is an ultra compact HII region located at about 3.3 kpc (Kuchar & Bania 1994). The line of sight crosses the Sagittarius arm at velocities between ~20 and ~35 km s-1, and also samples the local ISM for LSR velocities lower than 20 km s-1. The HIFI spectra are shown in Figs. B.10 and B.11. The [C ii] line is strongly self-absorbed towards G34.3+0.15 and presents an asymmetric spatial distribution. The [C i] ![]() emission is weak in the foreground gas. The tiny absorption at ~15 km s-1 is due to a low level contamination in the reference position used in the Load Chop observations. The emission features in the [C i]
emission is weak in the foreground gas. The tiny absorption at ~15 km s-1 is due to a low level contamination in the reference position used in the Load Chop observations. The emission features in the [C i] ![]() spectra are excited molecular lines associated with the G34.3+0.15 hot cores. The PACS spectral maps near 158 μm are presented in Fig. B.12.
spectra are excited molecular lines associated with the G34.3+0.15 hot cores. The PACS spectral maps near 158 μm are presented in Fig. B.12.
Appendix B.5: W49N
W49N is one of the most luminous star forming region in the Galaxy. It is located in the Perseus arm at a distance of 11.4 kpc (Gwinn et al. 1992). The line of sight crosses the Sagittarius arm twice along this very long line of sight.
Appendix B.6: W51
W51 is a very massive star formation complex in the Sagittarius arm at a distance of ~5.4 kpc (Sato et al. 2010). The line of sight crosses the local ISM, and also probes relatively diffuse material in the foreground of W51 at velocities ~45 and ~65 km s-1. The HIFI spectra are shown in Figs. B.13 and B.14. The [C ii] spectra show extended wings associated with the CO molecular outflow. The spectra are self reversed over a significant fraction of the map. Despite the high sensitivity reached in these data, we could not detect [C i] either in absorption nor in emission associated with the prominent features at ~6 and ~20 km s-1. The weak emission features in the [C i] ![]() and
and ![]() spectra are unrelated molecular lines associated with the W51 E1/E2 hot cores. The PACS spectral maps near 158 μm are presented in Fig. B.15.
spectra are unrelated molecular lines associated with the W51 E1/E2 hot cores. The PACS spectral maps near 158 μm are presented in Fig. B.15.
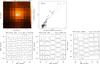 |
Fig. B.6
PACS data towards W31C. For all maps, the offsets are given relative to the central position listed in Table 1. Top left: continuum emission at 158 μm. Contour levels are drawn at 0.2, 0.3, 0.4 ... 0.9 relative to the maximum. Top right: comparison of the integrated absorption measured in the HIFI map relative to the absorption at the map center, with the continuum flux measured in the PACS map relative to the map center. The dashed red line shows the linear regression line and the dotted black line a 1:1 relationship. Bottom left: [C ii] emission in the 25 PACS spaxels. The continuum emission has been subtracted. The vertical scale runs from −150 to 170 Jy. Bottom middle: map of the [C ii] line to continuum emission/absorption in the 25 PACS spaxels. The vertical scale runs from 0.85 to 3.0. Please note the very low contrast in the central spaxels. Bottom right: map of the [O i] 63 μm line to continuum emission/absorption in the 25 PACS spaxels. The vertical scale runs from 0.3 to 2.6. |
| Open with DEXTER | |
Appendix B.7: DR21(OH)
DR21(OH) is one of the most massive cores in the Cygnus molecular cloud complex. At a distance of ~1.5 kpc (Rygl et al. 2012), the line of sight mostly probes the material in the Cygnus region. While the material directly associated with DR21(OH) appears at slightly negative LSR velocities, the foreground gas is seen near 10 km s-1 and could be associated with W75N a few arc-minutes to the northeast. The HIFI spectra are shown in
Figs. B.16 and B.17. The PACS spectral maps near 158 μm are presented in Fig. B.18.
As DR21(OH) is a very weak continuum source at 1.4 GHz, the HI data also make use of the absorption towards the stronger continuum source DR 21, 3 arcmin to the south.
Appendix B.8: W3-IRS5
W3-IRS5 is a massive protostar in the W3 star forming complex at a distance of ~2 kpc (Xu et al. 2006). Located in the second Galactic quadrant, the line of sight towards W3-IRS5 is probing the outer Galaxy. The HIFI spectra are shown in Figs. B.19 and B.20. They include the ground state transition of HF at 1.2 THz. A deep and narrow velocity component is detected at ~−20 km s-1, and a broader one near 0 km s-1. The H2 column densities have been derived from the HF data using [HF]/[H2] = 1.3 × 10⁻⁸ (Sonnentrucker et al. 2010).
The PACS spectral maps near 158 μm are presented in Fig. B.21. The line of sight towards W3 has been studied in HI Normandeau (1999). Herschel/HIFI spectra exhibiting absorption from both the W3 complex and foreground material have been presented by Benz et al. (2010).
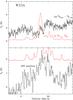 |
Fig. B.7
Top: Herschel/HIFI spectra towards W33A. The red line shows the [C i] |
| Open with DEXTER | |
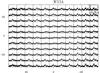 |
Fig. B.8
Montage of [C ii] spectra towards W33A. A baseline has been subtracted from all spectra. The horizontal axis is the LSR velocity in km s-1, which runs from −23 km s-1 to 95 km s-1, and the vertical axis the antenna temperature in Kelvins, which runs from −1 ˛ to 6 K. The x-axis shows the right ascension offset in arcsec and the y-axis the declination offset in arcsec, relative to the source position given in Table 1. |
| Open with DEXTER | |
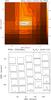 |
Fig. B.9
PACS data towards W33A. The offsets are given relative to the central position listed in Table 1. Top: continuum emission at 158 μm. Contour levels are 0.2, 0.3, 0.4 ... 0.9 relative to the maximum. Bottom: map of the line to continuum emission/absorption in the 25 PACS spaxels. The vertical scale runs from 0.85 to 2.5. Please note the very low contrast in the central spaxels. The data have not been corrected for the contamination in the OFF beam. |
| Open with DEXTER | |
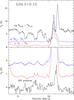 |
Fig. B.10
Top: Herschel/HIFI spectra towards G34.3+0.15. The red line shows the [C i] |
| Open with DEXTER | |
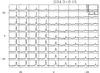 |
Fig. B.11
Montage of [C ii] spectra towards G34.3+0.15. A baseline has been subtracted from all spectra. The horizontal axis is the LSR velocity in km s-1, which runs from −15 km s-1 to 90 km s-1, and the vertical axis is the antenna temperature in Kelvins, which runs from −5 K to 18 K. The x-axis shows the right ascension offset in arcsec and the y-axis the declination offset in arcsec, relative to the source position given in Table 1. |
| Open with DEXTER | |
|
Fig. B.12
PACS data towards G34.3+0.15. For all maps, the offsets are given relative to the central position listed in Table 1. Top: continuum emission at 158 μm. Contour levels are at 0.2, 0.3, 0.4 ... 0.9 relative to the maximum. Middle: comparison of the integrated absorption measured in the HIFI map relative to the absorption at the map center, with the continuum flux measured in the PACS map relative to the map center. The dashed red line shows the linear regression line and the dotted black line a 1:1 relationship. Bottom: [C ii] Map of the line to continuum emission/absorption in the 25 PACS spaxels. The vertical scale runs from 0.85 to 2.5. The data have not been corrected for possible contamination in the OFF position. |
|
| Open with DEXTER | |
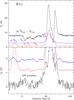 |
Fig. B.13
Top: Herschel/HIFI spectra towards W51. The red line shows the [C i] |
| Open with DEXTER | |
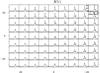 |
Fig. B.14
Montage of [C ii] spectra towards W51. A baseline has been subtracted from all spectra. The horizontal axis is the LSR velocity in km s-1, which runs from −28 km s-1 to 108 km s-1, and the vertical axis is the antenna temperature in K, which runs from −6 K to 47 K. The x-axis shows the right ascension offset in arcsec and the y-axis the declination offset in arcsec, relative to the source position given in Table 1. |
| Open with DEXTER | |
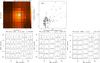 |
Fig. B.15
PACS data towards W51. For all maps, the offsets are given relative to the central position listed in Table 1. Top left: continuum emission at 158 μm. Contour levels are drawn at 0.2, 0.3, 0.4 ... 0.9 relative to the maximum. Top right: comparison of the integrated absorption measured in the HIFI map relative to the absorption at the map center, with the continuum flux measured in the PACS map relative to the map center. The dashed red line shows the linear regression line and the dotted black line a 1:1 relationship. Bottom left: [C ii] emission in the 25 PACS spaxels. The continuum emission has been subtracted. The vertical scale runs from −100 to 500 Jy. Bottom middle: map of the [C ii] line to continuum emission/absorption in the 25 PACS spaxels. The vertical scale runs from 0.85 to 3. Bottom right: map of the [O i] 63 μm line to continuum emission/absorption in the 25 PACS spaxels. The vertical scale runs from 0.7 to 4. |
| Open with DEXTER | |
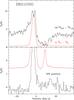 |
Fig. B.16
Top: Herschel/HIFI spectra towards DR21(OH). The red line shows the [C i] |
| Open with DEXTER | |
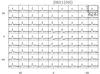 |
Fig. B.17
Montage of [C ii] spectra towards DR21(OH). A baseline has been subtracted from all spectra. The horizontal axis is the LSR velocity in km s-1, which runs from −28 km s-1 to 38 km s-1, and the vertical axis is the antenna temperature in Kelvins, which runs from −4 K to 14 K. The x-axis shows the right ascension offset in arcsec and the y-axis the declination offset in arcsec, relative to the source position given in Table 1. |
| Open with DEXTER | |
|
Fig. B.18
PACS data towards DR21(OH). For all maps, the offsets are given relative to the central position listed in Table 1. Top: continuum emission at 158 μm. Contour levels are 0.2, 0.3, 0.4 ... 0.9 relative to the maximum. Middle: comparison of the integrated absorption measured in the HIFI map relative to the absorption at the map center, with the continuum flux measured in the PACS map relative to the map center. The dashed red line shows the linear regression line and the dotted black line a 1:1 relationship. Bottom: map of the line to continuum emission/absorption in the 25 PACS spaxels. The vertical scale runs from 0.85 to 2.5. The data have not been corrected for contamination in the OFF position. |
|
| Open with DEXTER | |
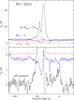 |
Fig. B.19
Top: Herschel/HIFI spectra towards W3-IRS5. The black line shows the [C ii] |
| Open with DEXTER | |
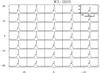 |
Fig. B.20
Montage of [C ii] spectra towards W3-IRS5. A baseline has been subtracted from all spectra. The horizontal axis is the LSR velocity in km s-1, which runs from −112 km s-1 to 32 km s-1, and the vertical axis is the antenna temperature in Kelvins, which runs from −5 K to 47 K. The x-axis shows the right ascension offset in arcsec and the y-axis the declination offset in arcsec, relative to the source position given in Table 1. |
| Open with DEXTER | |
|
Fig. B.21
PACS data towards W3-IRS5. For all maps, the offsets are given relative to the central position listed in Table 1. Top: continuum emission at 158 μm. Contour levels are 0.2, 0.3, 0.4 ... 0.9 relative to the maximum. Middle: comparison of the integrated absorption measured in the HIFI map relative to the absorption at the map center, with the continuum flux measured in the PACS map relative to the map center. The dashed red line shows the linear regression line and the dotted black line a 1:1 relationship. Bottom: map of the line to continuum emission/absorption in the 25 PACS spaxels. The vertical scale runs from 0.85 to 2.5. The data have not been corrected for the contamination in the OFF position. |
|
| Open with DEXTER | |
© ESO, 2014
Current usage metrics show cumulative count of Article Views (full-text article views including HTML views, PDF and ePub downloads, according to the available data) and Abstracts Views on Vision4Press platform.
Data correspond to usage on the plateform after 2015. The current usage metrics is available 48-96 hours after online publication and is updated daily on week days.
Initial download of the metrics may take a while.