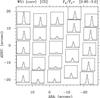
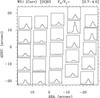
Fig. B.15
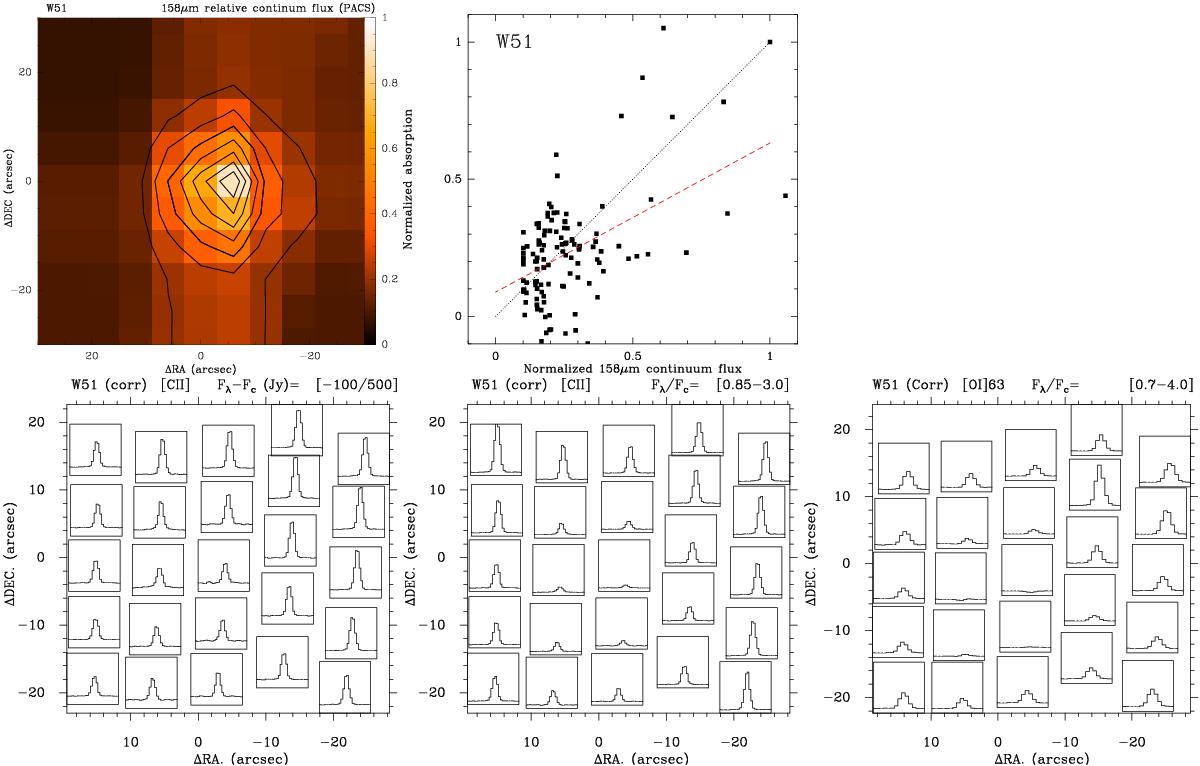
PACS data towards W51. For all maps, the offsets are given relative to the central position listed in Table 1. Top left: continuum emission at 158 μm. Contour levels are drawn at 0.2, 0.3, 0.4 ... 0.9 relative to the maximum. Top right: comparison of the integrated absorption measured in the HIFI map relative to the absorption at the map center, with the continuum flux measured in the PACS map relative to the map center. The dashed red line shows the linear regression line and the dotted black line a 1:1 relationship. Bottom left: [C ii] emission in the 25 PACS spaxels. The continuum emission has been subtracted. The vertical scale runs from −100 to 500 Jy. Bottom middle: map of the [C ii] line to continuum emission/absorption in the 25 PACS spaxels. The vertical scale runs from 0.85 to 3. Bottom right: map of the [O i] 63 μm line to continuum emission/absorption in the 25 PACS spaxels. The vertical scale runs from 0.7 to 4.
Current usage metrics show cumulative count of Article Views (full-text article views including HTML views, PDF and ePub downloads, according to the available data) and Abstracts Views on Vision4Press platform.
Data correspond to usage on the plateform after 2015. The current usage metrics is available 48-96 hours after online publication and is updated daily on week days.
Initial download of the metrics may take a while.