Fig. B.16
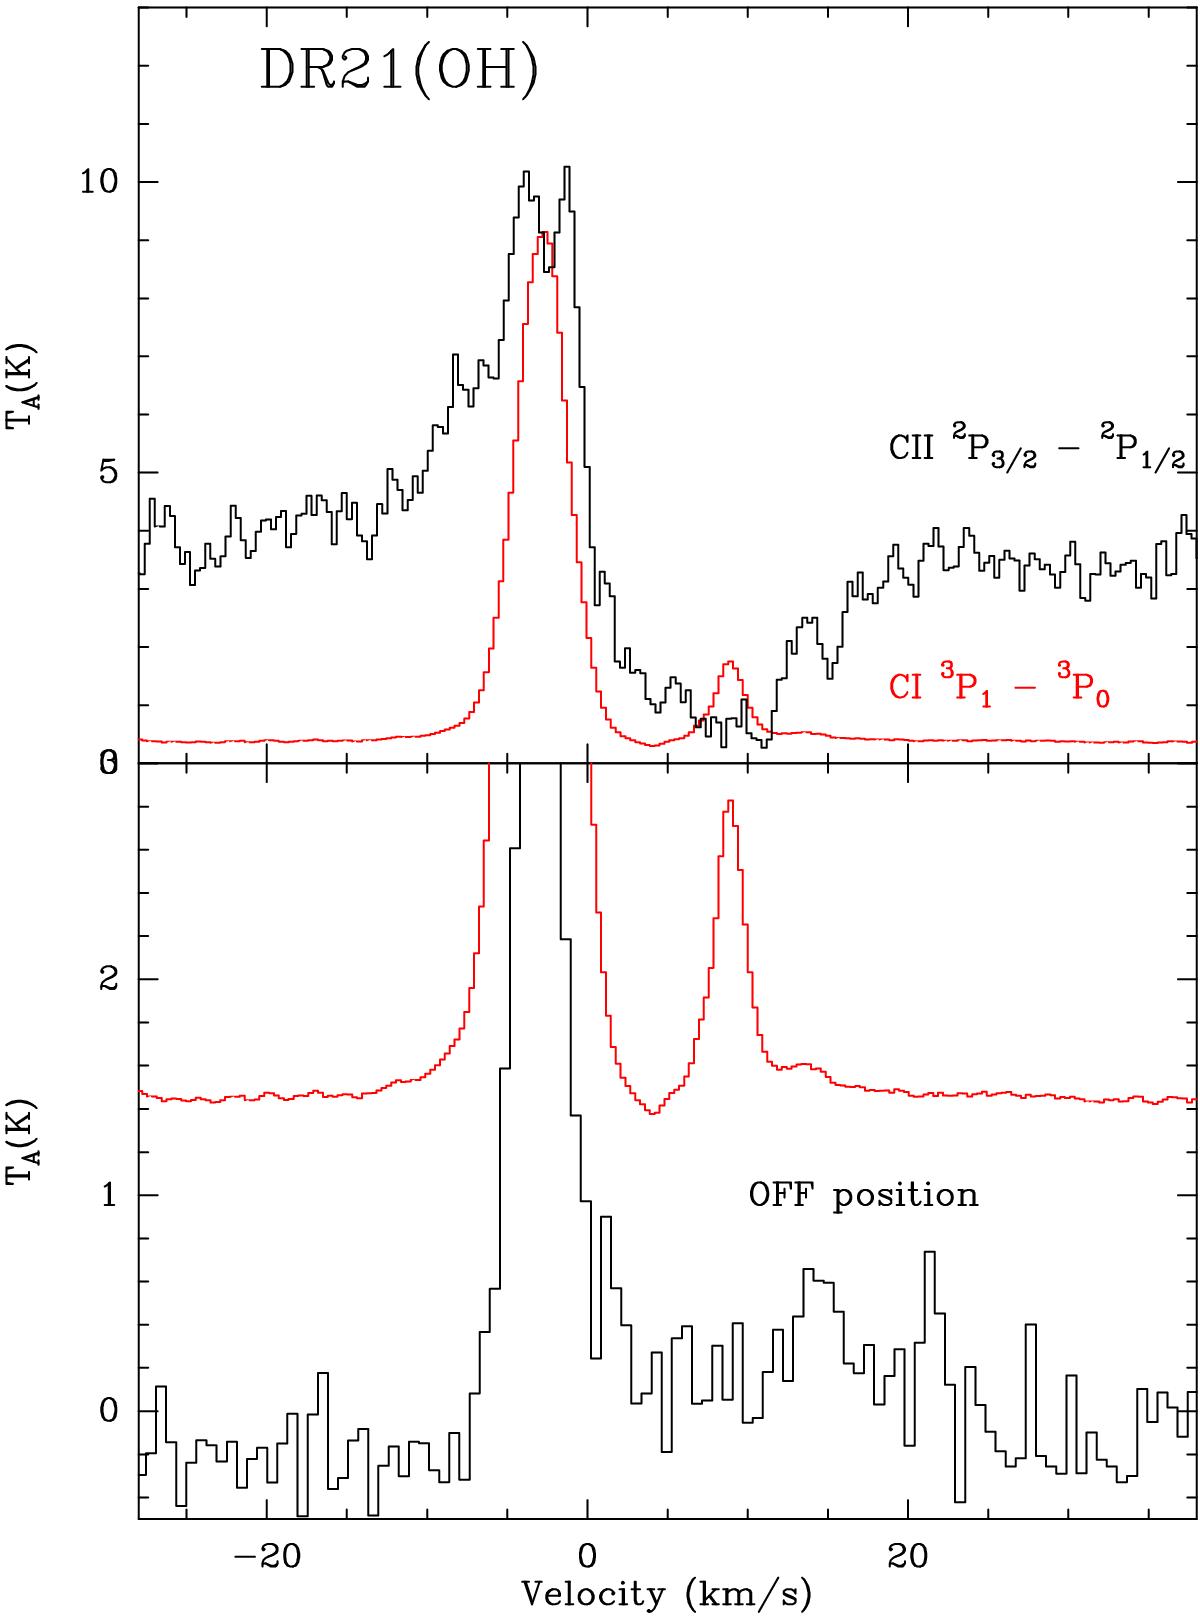
Top: Herschel/HIFI spectra towards DR21(OH). The red line shows the [C i]![]() line at 492 GHz, the blue line shows the [C i]
line at 492 GHz, the blue line shows the [C i]![]() line at 809 GHz and the black line the [C ii]
line at 809 GHz and the black line the [C ii]![]() line at 1.9 THz. The horizontal axis is the LSR velocity in km s-1 and the vertical axis the antenna temperature in Kelvins. The continuum level for [C ii] corresponds to the SSB continuum level. Bottom: zoom on the [C i] lines (red,blue as above), and average [C ii] spectrum of the OFF positions (black). The continuum levels have been shifted for clarity in the bottom panel.
line at 1.9 THz. The horizontal axis is the LSR velocity in km s-1 and the vertical axis the antenna temperature in Kelvins. The continuum level for [C ii] corresponds to the SSB continuum level. Bottom: zoom on the [C i] lines (red,blue as above), and average [C ii] spectrum of the OFF positions (black). The continuum levels have been shifted for clarity in the bottom panel.
Current usage metrics show cumulative count of Article Views (full-text article views including HTML views, PDF and ePub downloads, according to the available data) and Abstracts Views on Vision4Press platform.
Data correspond to usage on the plateform after 2015. The current usage metrics is available 48-96 hours after online publication and is updated daily on week days.
Initial download of the metrics may take a while.