| Issue |
A&A
Volume 573, January 2015
|
|
|---|---|---|
| Article Number | A93 | |
| Number of page(s) | 21 | |
| Section | Extragalactic astronomy | |
| DOI | https://doi.org/10.1051/0004-6361/201423993 | |
| Published online | 23 December 2014 | |
Online material
Appendix A
Sources observed with the Effelsberg telescope at 10.45 and 4.85 GHz.
Table A.1 contains general information on our sample, including redshift, coordinates, fluxes, morphological and spectral classification.
|
Fig. A.1
Spectral index distribution in all the low-ionization emission-line diagnostic diagrams. The [O i]-based diagram shows 100 galaxies, and the [S ii]-based diagram shows 100. |
|
| Open with DEXTER | |
Figure A.1 shows the [O i]- and the [S ii]-based diagnostic diagrams. Here a flattening sequence is less visible, because of the lack of the composite region (Fig. 5). This is because the Kewley et al. (2006) scheme for the [N ii]-based diagram substantially changes the LINER boundaries and includes a class for starburst-AGN composites.
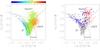 |
Fig. A.2
Black hole masses of the objects of the SDSS-FIRST cross-matched sample, represented in the [NII]-based diagram. Left panel: the color bar indicates MBH in solar units. Right panel: gray dots represent the overall black-hole mass distribution as in the left panel; red triangles indicate SDSS sources with velocity dispersion mismeasurements; blue squares indicate sources with MBH> 109.3 M⊙ (not flagged σ mismeasurements) overestimating black-hole mass measurements |
| Open with DEXTER | |
The SDSS-FIRST cross-matched sample is composed by 3391 star-forming, 2933 composite, 1057 Seyfert, and 1005 LINER galaxies for which we can trust the black-hole mass estimations. Figure A.2 presents the black-hole mass distribution of the objects in this sample. The distribution shows that the black hole mass clearly increases from star-forming galaxies to composites and LINERs. Mean (median) black hole mass values per spectral class are 7.1 (7.2) for star-forming, 7.5 (7.6) for composite, 7.6 (7.6) for Seyfert, and 8.0 (8.1) for LINER galaxies. The trend shown here is very clear, even though black-hole mass measurements are not direct but derived from the SDSS stellar velocity dispersion. The plot shows a substantial change in the galaxy populations, which is reflected by the Effelsberg sample (Fig. 9). The right
panel of Fig. A.2 presents the overall black-hole mass distribution of the SDSS-FIRST sample overimposed with red triangles, which indicate SDSS sources with velocity dispersion mismeasurements (25 star-forming, 27 composite, 102 Seyfert, and 24 LINER galaxies), and blue squares, which indicate sources with MBH> 109.3 M⊙ (63 star-forming, 38 composite, 43 Seyfert, and 4 LINER galaxies). The latter could be again the result of velocity dispersion mismeasurements, not flagged in the SDSS DR7. Some sources are marked as both red triangles and blue squares, indicating that the high black hole masses measured for the objects marked as blue squares could indeed be due to velocity dispersion mismeasurements. It is interesting to note that 57% of the red triangles are Seyferts, while 43% of the blue squares are star-forming galaxies. Moreover, those Seyferts show especially high log [O iii]/Hβ ratios (> 1), and those star-forming galaxies occupy the metal-poor part of the star-forming branch.
The color composite images from SDSS are shown in Figs. A.3 to A.6 illustrate the optical morphology of our radio-emitting star-forming, composite, Seyfert, and LINER galaxies. Star-forming galaxies are in general blue, and the galaxy color gets progressively redder in the other spectral types. Only a few galaxies are close enough (z ~ 0.05) for their morphology to be determined by eye.
|
Fig. A.3
Optical (SDSS) images of star-forming galaxies drawn from our optical-radio sample. |
|
| Open with DEXTER | |
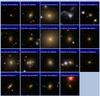 |
Fig. A.4
Composite galaxies. |
| Open with DEXTER | |
|
Fig. A.5
Seyfert galaxies. |
|
| Open with DEXTER | |
|
Fig. A.6
LINER galaxies |
|
| Open with DEXTER | |
© ESO, 2014
Current usage metrics show cumulative count of Article Views (full-text article views including HTML views, PDF and ePub downloads, according to the available data) and Abstracts Views on Vision4Press platform.
Data correspond to usage on the plateform after 2015. The current usage metrics is available 48-96 hours after online publication and is updated daily on week days.
Initial download of the metrics may take a while.