Fig. A.2
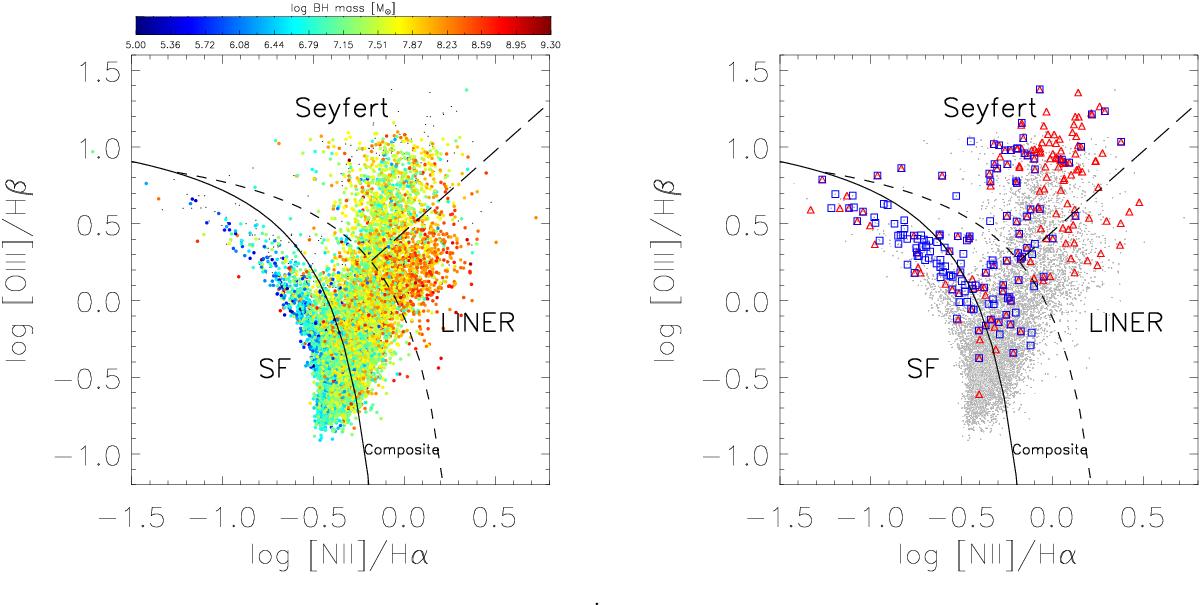
Black hole masses of the objects of the SDSS-FIRST cross-matched sample, represented in the [NII]-based diagram. Left panel: the color bar indicates MBH in solar units. Right panel: gray dots represent the overall black-hole mass distribution as in the left panel; red triangles indicate SDSS sources with velocity dispersion mismeasurements; blue squares indicate sources with MBH> 109.3 M⊙ (not flagged σ mismeasurements) overestimating black-hole mass measurements
Current usage metrics show cumulative count of Article Views (full-text article views including HTML views, PDF and ePub downloads, according to the available data) and Abstracts Views on Vision4Press platform.
Data correspond to usage on the plateform after 2015. The current usage metrics is available 48-96 hours after online publication and is updated daily on week days.
Initial download of the metrics may take a while.