| Issue |
A&A
Volume 572, December 2014
|
|
|---|---|---|
| Article Number | A21 | |
| Number of page(s) | 49 | |
| Section | Interstellar and circumstellar matter | |
| DOI | https://doi.org/10.1051/0004-6361/201424267 | |
| Published online | 21 November 2014 | |
Online material
Appendix A: Supplementary material
Observed water lines.
Observation identification numbers.
Observed properties of ortho-water line profiles.
Observed properties of para-water line profiles.
Observed properties of H O line profiles.
Gaussian decomposition results.
Gaussian decomposition results.
Gaussian decomposition results.
Gaussian decomposition results.
Gaussian decomposition results.
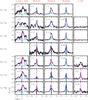 |
Fig. A.1
Observed H2O spectra for Class 0 sources in the WISH sample. All spectra are continuum-subtracted and have been recentred so that the source velocity is at 0 km s-1 for ease of comparison. Some spectra have also been resampled to a lower velocity resolution for ease of comparison. The red, cyan and green lines show the individual Gaussian components for the cavity shock, spot shocks, and quiescent envelope respectively (see text and Table 3 for details) while the blue dashed line shows the combined fit for each line. The vertical dashed magenta lines indicate regions which are masked during the fitting. |
| Open with DEXTER | |
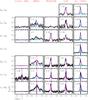 |
Fig. A.2
As in Fig. A.1. |
| Open with DEXTER | |
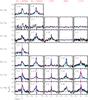 |
Fig. A.3
As in Fig. A.1. |
| Open with DEXTER | |
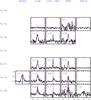 |
Fig. A.4
As in Fig. A.1 but for Class I sources. |
| Open with DEXTER | |
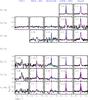 |
Fig. A.5
As in Fig. A.1 but for Class I sources. |
| Open with DEXTER | |
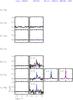 |
Fig. A.6
As in Fig. A.1 but for Class I sources. |
| Open with DEXTER | |
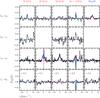 |
Fig. A.7
Observed H |
| Open with DEXTER | |
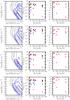 |
Fig. A.8
radex results for the FWHM = 23.0 and 39.8 km s-1 spot shocks for L1448-MM (top and upper-middle) and the cavity shock (lower-middle) for L1448-MM and the cavity shock component for IRAS2A (bottom). The left-hand panels show the best-fit (red cross) and 1, 3 and 5σ confidence limits (blue contours) for a grid in nH2 and NH2O. The black dashed contours show the corresponding radius of the emitting region. The middle panels show a spectral line energy distribution comparing the observed (blue for H2O, green for H |
| Open with DEXTER | |
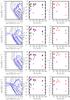 |
Fig. A.9
As in Fig. A.8 but for the spot shock component of IRAS2A (top), the FWHM = 9.9 km s-1 spot shock and cavity shock components of IRAS4A (upper and lower-middle) and the spot shock component of IRAS4B (bottom). |
| Open with DEXTER | |
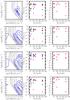 |
Fig. A.10
As in Fig. A.8 but for the cavity shock components of IRAS4B (top) L1527 (upper-middle), and the FWHM = 28.3 km s-1 spot shock and cavity shock components of BHR71. |
| Open with DEXTER | |
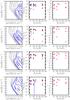 |
Fig. A.11
As in Fig. A.8 but for the FWHM = 59.0 km s-1 spot shock of BHR71 (top) and the cavity shocks of IRAS 15398 (upper-middle), L483 (lower-middle) and the FWHM = 3.7 km s-1 spot shock of Ser-SMM1 (bottom). |
| Open with DEXTER | |
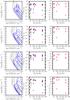 |
Fig. A.12
As in Fig. A.8 but for the cavity shock of Ser-SMM1 (top), Ser-SMM3 (upper-middle), the spot shock and cavity shock of Ser-SMM4 (lower-middle and bottom). |
| Open with DEXTER | |
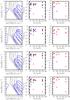 |
Fig. A.13
As in Fig. A.8 but for the cavity shock of L723 (top), the spot and cavity shocks of B335 (upper and lower-middle), and the cavity shock of L1157 (bottom). |
| Open with DEXTER | |
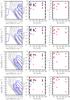 |
Fig. A.14
As in Fig. A.8 but for the FWHM = 35.7 km s-1 and 47.7 km s-1 spot shocks of L1157 (top and upper-middle), and the cavity shocks of L1489 (lower-middle) and TMR1 (bottom). |
| Open with DEXTER | |
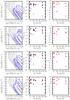 |
Fig. A.15
As in Fig. A.8 but for the cavity shocks of TMC1 (top), the spot and cavity shocks of IRAS 12496 (upper and lower-middle) and the cavity shock of GSS30-IRS5 (bottom). |
| Open with DEXTER | |
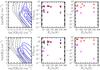 |
Fig. A.16
As in Fig. A.8 but for the cavity shocks of Elias29 (top) and RNO91 (bottom). |
| Open with DEXTER | |
Appendix B: Specific sources
This section discusses in detail the line comparison for three specific sources which require further mention: IRAS 15398, Ser-SMM3 and NGC 1333-IRAS4A.
Appendix B.1: IRAS 15398
As noted in Table 1, the position targeted in WISH for a few sources is offset slightly from the source centre as derived by SMA sub-mm interferometric observations. As part of OT2 programme OT2_evandish_4 the H2O 111 −000 line was observed towards the coordinates from Jørgensen et al. (2009). Figure B.1 shows a comparison between the WISH observations (black) and those from OT2_evandish_4 (red, obsid 1342266006). The central absorption and FWHM of the outflow component are broadly the same, though the outflow is centred closer to the source velocity and has a slightly lower Tpeak value in the newer observations. Ultimately this does not impact the conclusions for this source either in this paper or in Mottram et al. (2013), hence no other lines were re-observed. The HO 110 −101 line was also observed towards IRAS 15398 as part of OT2_evandish_4 (obsid 1342266008) with a noise level of 4 mK, but no line emission or absorption was detected.
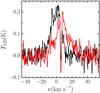 |
Fig. B.1
Comparison of the H2O 111 −000 observed as part of WISH towards the coordinates and towards the SMA coordinates as part of OT2_evandish_4 (red). |
| Open with DEXTER | |
Appendix B.2: Ser-SMM3
Ser-SMM3 is the one source where the line shape seems to vary between the different water transitions. In particular, in Fig. 2 the blue wing of the main outflow component seem to be missing in some of the higher frequency transitions, especially for the 212 −101 (1670 GHz) line. This is also one of the few sources to show a shock component in absorption, and it is also blue-shifted with respect to the source velocity. Kristensen et al. (2013) argue that this component is absorbing only against the continuum, which is stronger at higher frequencies. We therefore suggest that the reason the blue wing is decreased or missing in some transitions is due to absorption by the shock component. This source is therefore still consistent with all sources showing no variation in line profile between the different transitions observed with HIFI.
Appendix B.3: NGC 1333-IRAS4A
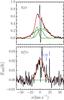 |
Fig. B.2
Comparison of the 110 −101 transitions of H2O (top) and H |
| Open with DEXTER | |
Figure B.2 shows a comparison of the H2O and HO 110 −101 observations towards IRAS4A, along with the Gaussian decomposition of those lines. The sharp narrow peaks are due to CH emission in the other side-band and so should be ignored for the following discussion. As discussed in Sect. 3.2 and shown in Fig. B.2, the outflow component (broadest Gaussian) is not detected in the HO observations, but the shock component near the source velocity is. This is also one of the few additional shock components which is approximately at the source velocity and lies in the region occupied by the outflow components in Fig. 7. Unlike any other shock component, the intensity of this component decreases with decreasing beam-size of the observations and it is not detected at all in the 212 −101 (1670 GHz) transition, which has a beam-size of 12.7′′. There are two off-source shocks in the IRAS4A outflow, B1 and R1, which both lie ~10′′ from the central source. This places at least a part of both B1 and R1 within the beam of most of the on-source observations, with the exception of the 212 −101 transition. The R1 position has been observed by Santangelo et al. (2014) and shows similar line-width to the on-source shock component. We therefore conclude that this component is coming from the B1 and/or R1 off-source shocks.
© ESO, 2014
Current usage metrics show cumulative count of Article Views (full-text article views including HTML views, PDF and ePub downloads, according to the available data) and Abstracts Views on Vision4Press platform.
Data correspond to usage on the plateform after 2015. The current usage metrics is available 48-96 hours after online publication and is updated daily on week days.
Initial download of the metrics may take a while.