Fig. A.7
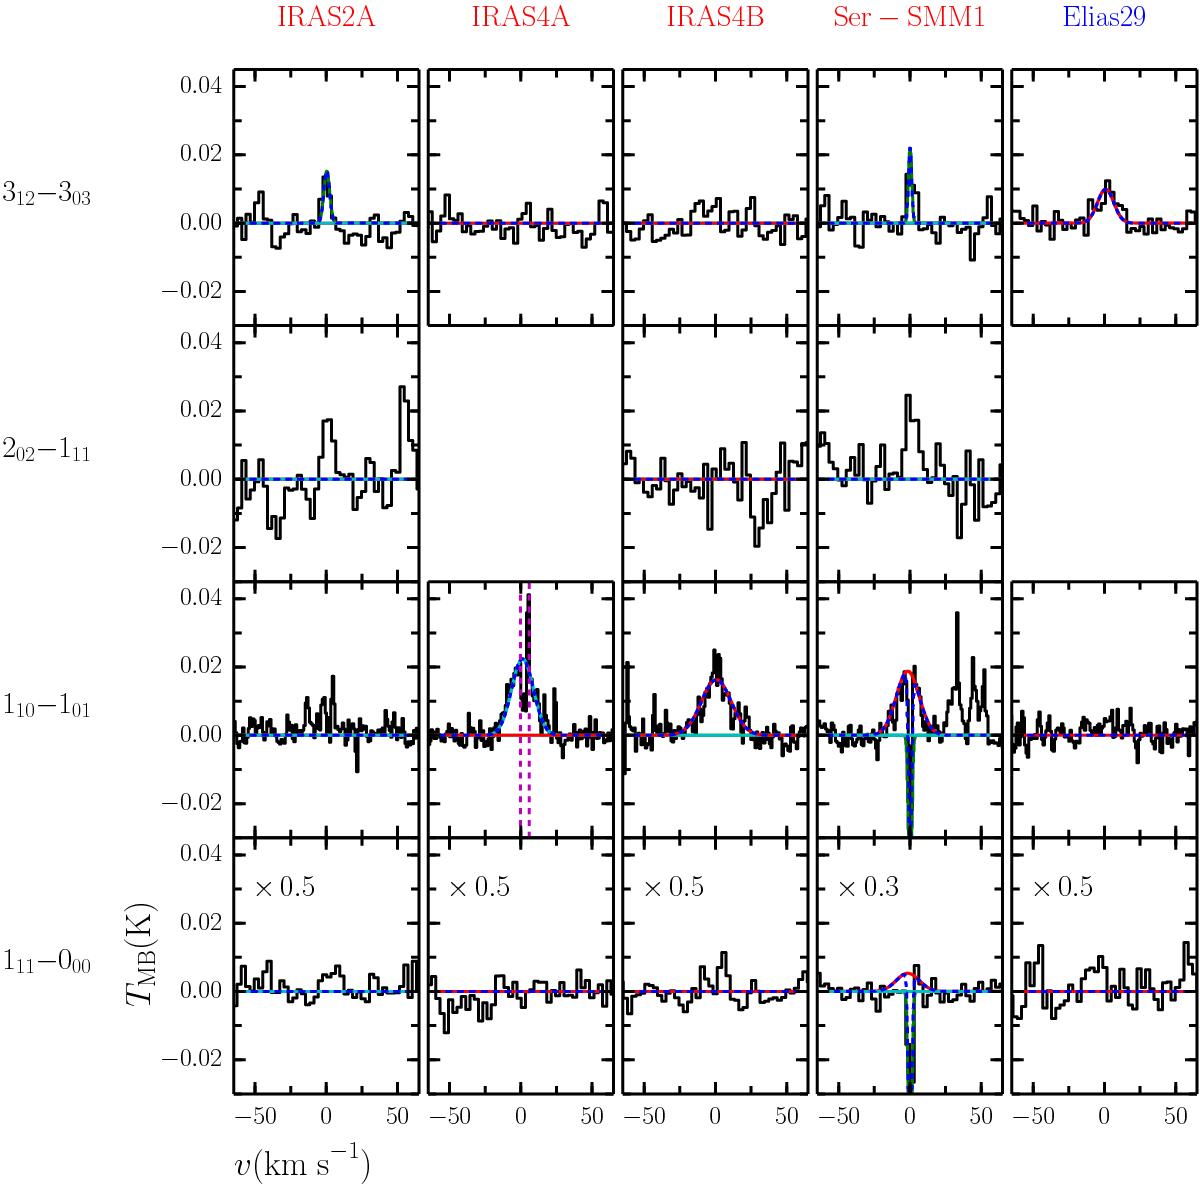
Observed H![]() O spectra for those Class 0 (red) and Class I (blue) sources with detections in at least one of the observed transitions. All spectra are continuum-subtracted and have been recentred so that the source velocity is at 0 km s-1 for ease of comparison. Some spectra have also been resampled to a lower velocity resolution for ease of comparison. The red, cyan and green lines show the individual Gaussian components for the cavity shock, spot shocks, and quiescent envelope respectively (see text and Table 3 for details) while the blue dashed line shows the combined fit for each line. The vertical dashed magenta lines indicate regions which are masked during the fitting. The 110 −101 observations also include the CH triplet which is in the other sideband.
O spectra for those Class 0 (red) and Class I (blue) sources with detections in at least one of the observed transitions. All spectra are continuum-subtracted and have been recentred so that the source velocity is at 0 km s-1 for ease of comparison. Some spectra have also been resampled to a lower velocity resolution for ease of comparison. The red, cyan and green lines show the individual Gaussian components for the cavity shock, spot shocks, and quiescent envelope respectively (see text and Table 3 for details) while the blue dashed line shows the combined fit for each line. The vertical dashed magenta lines indicate regions which are masked during the fitting. The 110 −101 observations also include the CH triplet which is in the other sideband.
Current usage metrics show cumulative count of Article Views (full-text article views including HTML views, PDF and ePub downloads, according to the available data) and Abstracts Views on Vision4Press platform.
Data correspond to usage on the plateform after 2015. The current usage metrics is available 48-96 hours after online publication and is updated daily on week days.
Initial download of the metrics may take a while.