Fig. B.2
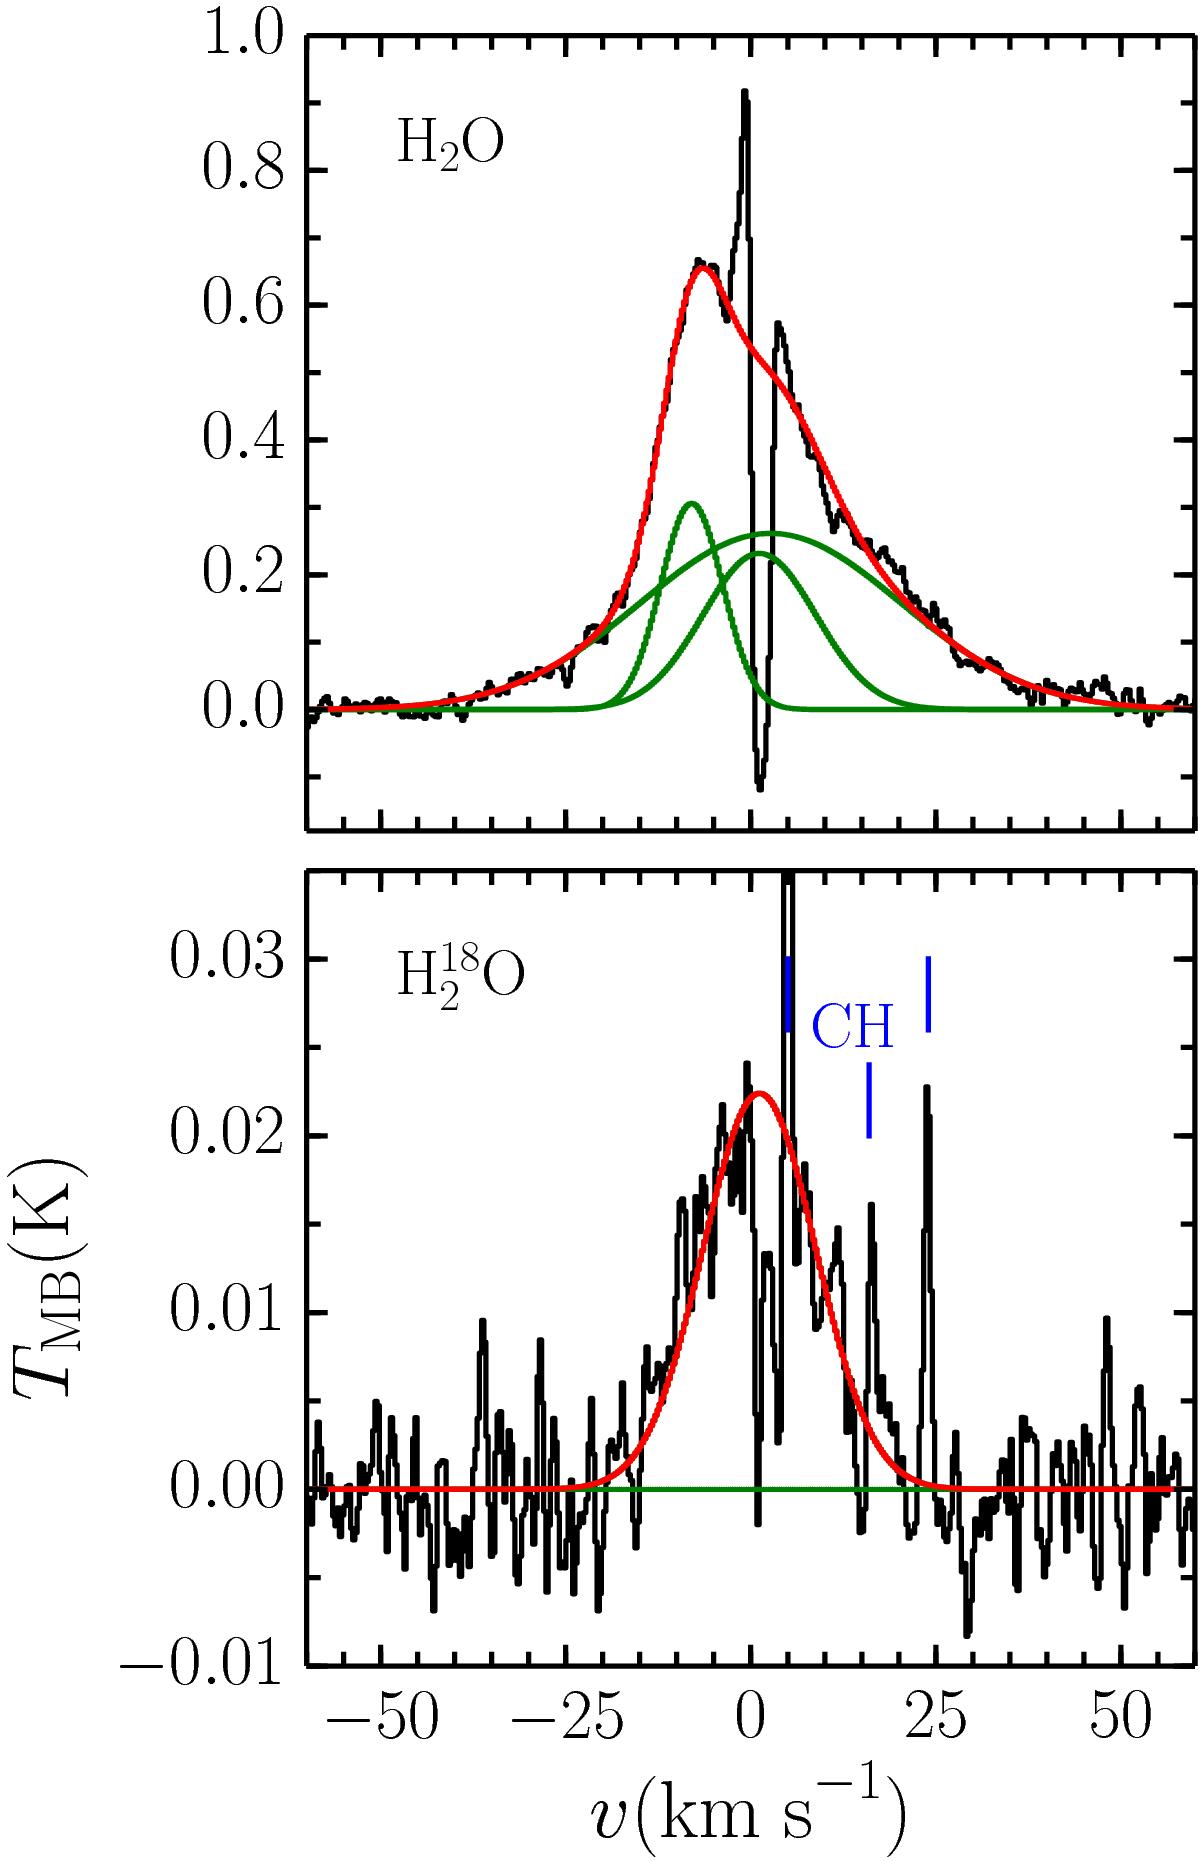
Comparison of the 110 −101 transitions of H2O (top) and H![]() O (bottom) towards IRAS4A. The black lines show the data, the green show the individual Gaussian components while the red shows the combination of all components present in a given line. The blue lines indicate the approximate velocities of the three CH transitions from the other sideband.
O (bottom) towards IRAS4A. The black lines show the data, the green show the individual Gaussian components while the red shows the combination of all components present in a given line. The blue lines indicate the approximate velocities of the three CH transitions from the other sideband.
Current usage metrics show cumulative count of Article Views (full-text article views including HTML views, PDF and ePub downloads, according to the available data) and Abstracts Views on Vision4Press platform.
Data correspond to usage on the plateform after 2015. The current usage metrics is available 48-96 hours after online publication and is updated daily on week days.
Initial download of the metrics may take a while.