Fig. A.8
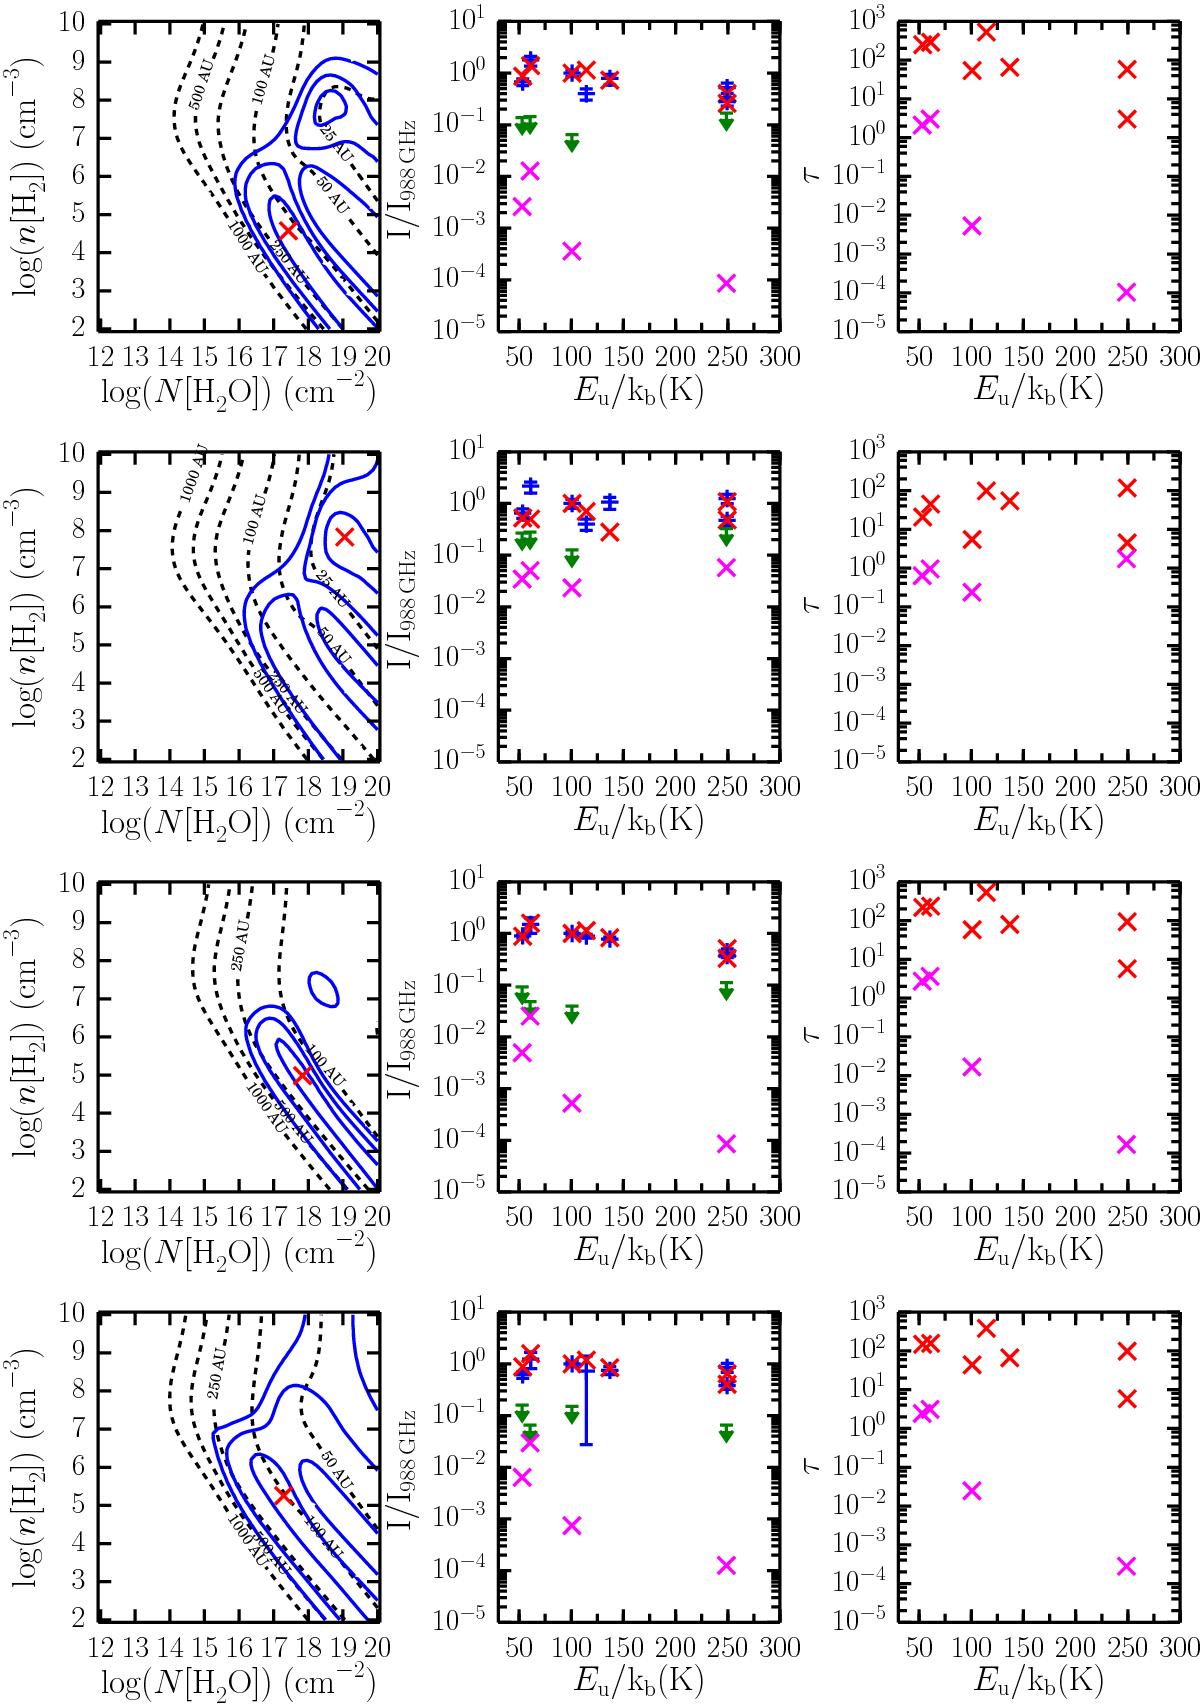
radex results for the FWHM = 23.0 and 39.8 km s-1 spot shocks for L1448-MM (top and upper-middle) and the cavity shock (lower-middle) for L1448-MM and the cavity shock component for IRAS2A (bottom). The left-hand panels show the best-fit (red cross) and 1, 3 and 5σ confidence limits (blue contours) for a grid in nH2 and NH2O. The black dashed contours show the corresponding radius of the emitting region. The middle panels show a spectral line energy distribution comparing the observed (blue for H2O, green for H![]() O) and best-fit model (red for H2O, magenta for H
O) and best-fit model (red for H2O, magenta for H![]() O) results. The right-hand panels show the optical depth for each line for the best-fit model.
O) results. The right-hand panels show the optical depth for each line for the best-fit model.
Current usage metrics show cumulative count of Article Views (full-text article views including HTML views, PDF and ePub downloads, according to the available data) and Abstracts Views on Vision4Press platform.
Data correspond to usage on the plateform after 2015. The current usage metrics is available 48-96 hours after online publication and is updated daily on week days.
Initial download of the metrics may take a while.