| Issue |
A&A
Volume 572, December 2014
|
|
|---|---|---|
| Article Number | A62 | |
| Number of page(s) | 20 | |
| Section | Stellar structure and evolution | |
| DOI | https://doi.org/10.1051/0004-6361/201423929 | |
| Published online | 28 November 2014 | |
Online material
Observed Lupus targets and their main properties.
Observed Serpens targets and their main properties.
H i lines and derived accretion parameters for Lupus targets.
H i lines and derived accretion parameters for Serpens targets.
Appendix A: Near-IR photometry
Near-infrared photometry of the Lupus targets derived from POISSON data, compared with 2MASS magnitudes.
Near-infrared photometry of the Serpens targets derived from POISSON data, compared with 2MASS magnitudes.
Measured JHK magnitudes of the sources are reported in Tables A.1 and A.2 together with 2MASS photometry, which is given for comparison. Small photometric variations (over time-scales of months/years) of about a few tenths of magnitude in the near-IR are typical of young objects (e.g. Alves de Oliveira & Casali 2008) and are generally attributed to varying accretion activity or extinction variations (see e.g. Carpenter et al. 2001).
In our samples most of the sources display this type of fluctuation, with a mean magnitude variation (in absolute value) of about 0.2, 0.1, and 0.1 mag (JHK-bands, respectively) in Lupus and 0.2, 0.2, and 0.4 mag in Serpens.
However, we were also able to identify a few objects that underwent significant brightness variations (of about 1 mag or greater in at least one of the bands): Sz98, [MJS2008] 133, and [MJS2008] 146 in Lupus and [WMW2007]70 and [WMW2007]4 in Serpens. In particular, [MJS2008] 133 appears much dimmer in POISSON data than in 2MASS observations and displays photometric variations of ΔJ = −1.5, ΔH = −1.9ΔK = −2.0 mag (Antoniucci et al. 2013b). These pronounced photometric fluctuations might indicate an EXor- (e.g. Lorenzetti et al. 2011) or UXor-type (e.g. Shenavrin et al. 2012) variability for these objects.
Appendix B: Determination of Ldisk, M∗, and age
Source disk luminosities employed in Sect. 4.2 were not available in the literature for Cha (Paper I) and L1641 objects (Paper II), therefore these were obtained using the estimates of the bolometric and stellar luminosities: Ldisk = Lbol – L∗. However, since the L∗ values given in Paper II for L1641 objects had been obtained as Lbol – Lacc, to determine Ldisk entirely independently of Lacc (like for other sub-samples), we have re-derived L∗ from the spectral type and I magnitude of the objects (J magnitude when I was not available) by integrating a NEXTGEN stellar spectrum (Hauschildt et al. 1999) of the same spectral type as the object normalised to the observed I (J) band flux. The new L∗ values thus obtained for L1641 are listed in Table B.1.
As mentioned in Sect. 4.1, to minimise systematic biases we decided to (re-)determine M∗ and age of all POISSON sources on the basis of the same pre-main sequence evolutionary models. For this task we considered the models by Siess et al. (2000, 1999), assuming a metallicity Z = 0.2 and no overshooting. The relative evolutionary tracks and isochrones are displayed in the HR diagram in Fig. B.1. Mass and age of the single objects were computed by interpolating (where possible) over the model grid. For sources located outside the area covered by the model grid only upper limits to the parameters are provided.
The main stellar parameters (L∗, Teff, Spectral Type, M∗, age) of all POISSON objects are listed (per region) in Tables B.1 and B.2, together with the determined mass accretion rate.
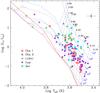 |
Fig. B.1
HR diagram for the sources of the five star-forming clouds analysed in POISSON (see legend). Superposed evolutionary tracks for labelled stellar masses in M⊙ (grey lines), isochrones for labelled time in years (blue dashed lines), ZAMS (solid red line), and early main sequence (dashed red lines) are taken from the models of Siess et al. (2000). The point with error bars shows the mean uncertainty on the position of the single sources. |
| Open with DEXTER | |
Main parameters of POISSON sources in Cha I, Cha II, and L1641, investigated in Papers I and II.
Appendix C: Example spectra
A few representative POISSON spectra of Lupus and Serpens sources are displayed in Fig. C.1, showing sources with different line-to-continuum ratios.
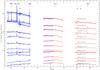 |
Fig. C.1
SofI near-IR spectra for a few selected Lupus and Serpens sources. Different colours refer to the two SofI grisms (blue and red). Spectra are shown in flux units of 5 × 10-15 erg s-1 cm-2μm-1 and were offset by a constant c and multiplied by a scale factor s (both indicated) for better visualisation. Wavelength intervals heavily corrupted by atmospheric absorption were removed. The position of the main emission lines present in the covered spectral range is indicated, as well as residuals from atmospheric features. |
| Open with DEXTER | |
© ESO, 2014
Current usage metrics show cumulative count of Article Views (full-text article views including HTML views, PDF and ePub downloads, according to the available data) and Abstracts Views on Vision4Press platform.
Data correspond to usage on the plateform after 2015. The current usage metrics is available 48-96 hours after online publication and is updated daily on week days.
Initial download of the metrics may take a while.